

Blog
Form 4 vs Form 5: Why Hazardous Waste Numbers Don't Match
EHSSaral is an Environmental Compliance Intelligence Platform for Industries. Consent Intelligence • Alerts & Tasks • Incident Reporting • Form IV & V • Audit-Ready Records
See how EHSSaral works
21 Aug 2026
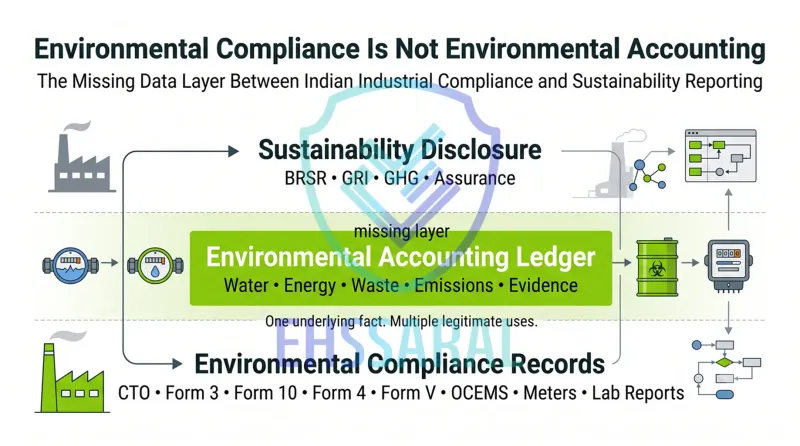
An Indian factory can meet its environmental obligations and still struggle to produce reliable BRSR, GRI or GHG data. This paper explains why environmental compliance and environmental accounting are structurally different-and proposes the missing data layer between them.
Previous Indian work has already documented weaknesses in the compilation and comparability of environmental data under BRSR. The Centre for Science and Environment's review of company disclosures, for example, found inconsistencies in environmental reporting and called for greater granularity and transparency. More recent research has attempted to cross-check BRSR environmental metrics against CPCB/SPCB and Form V information. These efforts demonstrate the problem.
in This article - The term “environmental accounting” in this paper refers primarily to structured accounting of physical environmental flows and activities, rather than environmental cost accounting or natural-capital accounting.
An industrial facility can hold a valid Consent to Operate, conduct prescribed environmental monitoring, maintain hazardous-waste records, file statutory returns and send waste only to authorised facilities-and still struggle to produce reliable sustainability data.
This apparent contradiction is not necessarily a failure of the EHS team.
It exists because environmental compliance and environmental accounting were designed to answer different questions.
Environmental compliance primarily asks:
Is the facility operating within applicable legal conditions, limits and obligations?
Environmental accounting asks:
What physically happened during the reporting period, how much occurred, how was the number derived, and can it be traced back to reliable evidence?
The first is largely a system of conditions, thresholds, permissions and evidence of compliance.
The second requires a ledger of environmental flows and activities.
Neither system is wrong.
The problem emerges when companies attempt to move directly from compliance records into BRSR, GRI, greenhouse-gas inventories, customer sustainability questionnaires or other disclosures-often by reconstructing the missing accounting layer through spreadsheets at the end of the year.
This paper argues that an important layer is missing between India's environmental-compliance infrastructure and modern sustainability reporting:
A useful architecture can be visualised as:
Layer 1 - Operational Environmental & Compliance Records
↓
Layer 2 - Environmental Accounting Ledger
↓
Layer 3 - Sustainability Disclosure, Assessment & Assurance
Many companies possess significant amounts of Layer 1 data.
They need Layer 3 outputs.
But Layer 2 often does not continuously exist.
It is reconstructed later.
That creates cost, inconsistency and what this paper calls sustainability data debt: the future reporting burden created when today's environmental activity is captured at insufficient granularity, context or evidence quality for tomorrow's legitimate reporting requirements.
The solution should not be another large environmental return.
Instead, environmental activity should increasingly be captured as structured, evidence-linked data capable of being reused.
A hazardous-waste dispatch, water-meter reading or fuel transaction should remain a traceable operational fact before it becomes an annual return, intensity ratio, emissions figure or sustainability disclosure.
This leads to the central architectural principle of this paper:
The regulator can use the attributes required for environmental law.
The EHS team can use the same event for compliance management.
The sustainability function can apply an accounting methodology.
An assessment or assurance provider can examine the evidence lineage.
Different systems can therefore interpret the same physical event without requiring the event itself to be repeatedly reconstructed.
There is, however, an important trade-off.
Better environmental data creates greater accountability.
A transaction-level ledger may expose quantity mismatches, unexplained balances and historical inconsistencies that aggregated records may obscure. Any movement toward greater environmental traceability therefore has to address ownership, confidentiality, corrections, version history and appropriate access alongside interoperability and reporting efficiency.
The objective is not to turn State Pollution Control Boards into ESG agencies.
Nor is it to make environmental compliance responsible for every social, governance or value-chain disclosure.
The opportunity is narrower and more practical:
Create a reliable environmental data foundation from normal industrial operations.
If that foundation exists, regulatory reporting and sustainability reporting no longer need to begin from separate versions of the same physical reality.
India's next stage of environmental digitisation should therefore move beyond simply digitising forms.
It should begin digitising the environmental events beneath those forms.
Consider a manufacturing facility at the end of a financial year.
Its environmental team has worked throughout the year.
The Consent to Operate is valid.
Environmental monitoring has been conducted.
Effluent-treatment records have been maintained.
Hazardous-waste records are available.
Waste movements have been documented.
Laboratory reports have been filed.
Annual environmental returns have been prepared.
Electricity bills exist.
Fuel purchase records exist.
Water meter readings exist.
Production data exists somewhere else in the organisation.
From a conventional environmental-compliance perspective, the facility may be reasonably well managed.
Then the corporate sustainability team sends a request.
It asks for:
Suddenly, hundreds of existing environmental records do not automatically become answers.
The EHS manager opens Excel.
Accounts is asked for invoices.
Production is asked for output.
Stores provides diesel information.
Waste manifests are reconciled.
Different units are converted.
Old meter records are checked.
Missing periods are investigated.
Assumptions are made.
Evidence is searched across folders and emails.
A reporting process begins that looks less like disclosure and more like reconstruction.
This is often called an ESG reporting problem.
But the reporting template is merely where the weakness becomes visible.
The deeper problem occurred earlier.
The environmental activity was captured for one immediate purpose but was not preserved with enough structure to support another legitimate use later.
The mechanical difference can be reduced to two questions.
Environmental accounting asks:
Environmental regulation necessarily deals with questions such as:
An effluent result may therefore be compared with a prescribed concentration.
A stack-monitoring result may be compared with the applicable standard or Consent condition.
A hazardous-waste activity may be checked against authorised waste categories and quantities.
A movement may be checked for appropriate documentation and an authorised destination.
These are critical environmental controls.
Environmental accounting has another task.
It must accumulate physical activity.
How much water entered the facility?
From which sources?
Where was it used?
How much was recycled?
How much left the boundary?
How much was consumed?
How much fuel was burned?
In which assets?
How much electricity was used?
How much waste was generated?
What happened to it?
How much production occurred?
Which methodology transformed these underlying facts into a disclosed environmental metric?
The difference can be represented as follows:
| Dimension | Environmental Compliance | Environmental Accounting |
|---|---|---|
| Primary question | Are we complying? | What physically occurred? |
| Typical focus | Condition, limit, concentration, authorisation | Flow, mass, volume, energy, activity |
| Time behaviour | May rely on prescribed periodic monitoring or reporting | Requires accumulation across the reporting period |
| Boundary | Legal/facility/activity boundary | Reporting, organisational or accounting boundary |
| Primary output | Compliance evidence | Environmental inventory or balance |
| Evidence purpose | Demonstrate fulfilment of an obligation | Reproduce and substantiate a number |
| Typical architecture | Document- and condition-centric | Transaction-, measurement- and calculation-centric |
| Failure test | Was a legal requirement breached? | Can the reported value be traced and recalculated? |
This distinction is not absolute.
Indian environmental regulation already requires substantial quantities of numerical data.
Online monitoring can produce high-frequency measurements.
Hazardous-waste registers contain transactional information.
Environmental Statements contain material, water and pollution-related information.
Likewise, sustainability frameworks contain qualitative disclosures, policies and regulatory information.
But the design centre is different.
One system principally protects environmental and regulatory boundaries.
The other attempts to account for environmental performance across time.
That distinction explains much of today's reporting friction.
It would be easy to conclude from this argument that Indian environmental compliance collects the "wrong" information.
That would be inaccurate.
Pollution-control legislation, Consent mechanisms, hazardous-waste rules and associated monitoring systems were developed to regulate environmental impacts and determine whether facilities were meeting legal obligations.
A hazardous-waste manifest is not deficient because it does not contain every field required by every sustainability reporting framework.
A Consent to Operate is not deficient because it does not calculate Scope 2 emissions.
A laboratory report is not deficient because it does not automatically generate a corporate water footprint.
They were designed for different purposes.
Similarly, sustainability reporting cannot replace pollution-control regulation.
A company may report improving water intensity while violating an effluent standard.
A facility may reduce GHG emissions while storing hazardous waste improperly.
An organisation may achieve a strong sustainability rating and still breach a Consent condition.
Environmental performance and environmental legality overlap, but they are not identical concepts.
The objective should therefore not be:
Turn environmental compliance into ESG reporting.
It should be:
Preserve the underlying environmental facts well enough that different legitimate systems can use them.
That distinction is fundamental.
Hazardous-waste management provides one of the clearest examples.
Indian industrial facilities handling hazardous waste may maintain records under the Hazardous and Other Wastes (Management and Transboundary Movement) Rules, 2016 and applicable amendments.
The practical information chain can include:
Generation
↓
Form 3 records
↓
Storage
↓
Dispatch
↓
Manifest / movement documentation
↓
Weighment
↓
Recycler / co-processor / TSDF
↓
Acknowledgement or other evidence
↓
Annual return
From a data-architecture perspective, this is already surprisingly close to a transaction ledger.
It contains physical movement.
It contains quantities.
It contains categories.
It contains destinations.
It contains evidence.
But the purpose of these records remains hazardous-waste regulation.
A downstream sustainability framework may classify the same physical activity according to another taxonomy.
For example, GRI 306 distinguishes waste diverted from disposal from waste directed to disposal and further differentiates particular recovery and disposal operations.[1]
A regulatory record may therefore contain enough information to demonstrate authorised movement without necessarily containing every semantic attribute required to map the same event automatically into another disclosure framework.
This distinction is subtle but important.
The conclusion should not be:
Form 4 does not contain enough ESG data.
The conclusion should be:
The waste transaction contains more potential information than any one regulatory form needs.
A better architecture therefore preserves the underlying movement.
A structured waste transaction might include:
Then different systems can consume different attributes.
The regulatory return sees one view.
The internal waste reconciliation sees another.
GRI mapping can use another.
An auditor can use the evidence chain.
The transaction itself does not need to be recreated.
Water makes the same distinction even more visible.
A factory's regulatory attention may reasonably focus on:
All are important.
But sustainability water accounting asks a broader physical-flow question.
A simplified system might look like:
Source
↓
Withdrawal
↓
Process / utility use
↓
Wastewater generation
↓
Treatment
↓
Recycle / reuse
↓
Discharge
↓
Consumption
GRI 303 separately addresses water withdrawal, discharge and consumption and recognises that water consumption may, where direct measurement is unavailable, be calculated using withdrawal and discharge data.[2]
That is fundamentally a balance.
An ETP sample demonstrating that BOD, COD or TSS meets a prescribed limit does not answer:
The monitoring report is not weak.
It is answering another question.
The same issue applies to Zero Liquid Discharge.
A ZLD condition describes an important pollution-control outcome.
But "zero liquid discharge" does not, by itself, constitute a complete water account.
A sustainability system may still need to understand:
withdrawal → internal circulation → recycle → evaporation/loss → consumption
This yields a useful distinction:
Carbon accounting exposes the organisational fragmentation particularly clearly.
Suppose a factory uses diesel.
Different departments may hold different parts of the underlying fact.
Accounts
holds invoices and expenditure.
Stores
holds fuel receipts and inventory.
Maintenance
holds DG runtime.
EHS
holds emissions-monitoring records.
Production
holds activity information.
Sustainability
needs GHG emissions.
The organisation possesses data.
But it does not necessarily possess a continuous environmental accounting ledger.
Compare:
August HSD consumed: 25,000 litres
with:
14 August
Plant A
DG-02
HSD issued: 1,200 litres
source document: stores issue record
equipment activity reference available
reporting boundary identified
The first preserves the total.
The second preserves the event and its lineage.
GHG Protocol approaches use activity data together with appropriate emission factors to derive emissions, and its Scope 2 guidance likewise discusses electricity activity data and applicable emission-factor approaches.[3][4]
If the detailed operational attributes have already been collapsed into a single monthly figure, later analysts may have to rely on allocations or assumptions that did not exist at the time of the activity.
Sometimes estimates are entirely legitimate.
The architectural problem arises when estimation is necessary only because useful source context was discarded.
India already has important examples of environmental digitisation.
Online Continuous Emission and Effluent Monitoring Systems are one of them.
CPCB's OCEMS protocols cover technology, installation, operation, calibration and electronic submission of online monitoring data.[5]
This demonstrates an important point:
Indian environmental regulation is already capable of working with machine-generated environmental information.
But monitoring and accounting remain different functions.
An online monitoring system may answer:
What concentration was recorded?
Was a parameter exceeding a prescribed level?
What was the trend?
An environmental account may ask:
What cumulative mass was emitted during the reporting period?
Depending on the pollutant and calculation methodology, that may additionally require information such as:
The implication is not that continuous monitoring is inadequate.
It is that:
Telemetry is an input.
Accounting is an interpretation of physical activity over a defined boundary and period.
Connecting the two is an architectural problem.
The current approach creates a hidden liability.
This paper calls it:
Sustainability data debt is:
The future reporting and verification burden created when today's environmental activity is captured at insufficient granularity, context or evidence quality for tomorrow's legitimate requirements.
Consider a company that retains only:
Diesel consumed in August: 25,000 litres.
Six months later, it wants to understand how much was used by different sources.
If that allocation was never recorded, software cannot recreate the historical fact with certainty.
Or imagine a water meter was replaced during the year but the old meter identification and closing reading were not preserved.
The annual total may still be estimated.
But the lineage has weakened.
Or imagine an environmental transaction was documented sufficiently for a regulatory purpose, while a downstream treatment attribute required by a later sustainability classification was never captured.
That information may no longer exist.
The problem is deeper than "bad Excel."
Companies frequently attempt to service this debt through:
Environmental accounting will always contain legitimate estimation and professional judgement.
But there is a meaningful difference between:
estimating something that could not reasonably be directly measured
and
estimating something because the underlying operational information was discarded.
A mature environmental data architecture should reduce the second category.
The problem can now be visualised more clearly.
BRSR / BRSR Core
GRI
GHG inventories
customer sustainability questionnaires
ESG-related disclosures
assessment / assurance
classification
aggregation
boundary rules
methodology
calculation
Water balance
Energy balance
Waste flows
Material flows
GHG activity data
Environmental intensities
Methodologies
Evidence lineage
Revision history
structured records
transactions
measurements
telemetry
documents
Consent conditions
Meters
Form 3
manifest records
annual returns
Environmental Statement
laboratory reports
OCEMS
ETP logs
fuel records
utility bills
production data
waste certificates
The central problem is:
Excel becomes the temporary bridge.
At reporting time, pieces of Layer 1 are gathered.
A temporary environmental account is created.
Metrics are calculated.
The disclosure is submitted.
The workbook is archived.
The next reporting period begins.
The company therefore repeatedly rebuilds the missing middle layer.
This is inefficient because Layer 2 should be a continuing operational asset, not an annual reporting project.
This leads to one of the paper's most important principles:
Reporting frameworks change.
Regulatory requirements change.
Emission factors change.
Boundaries change.
Companies enter different supply chains.
Customers ask different questions.
New reporting regimes emerge.
Attempting to create one permanent final "ESG number" is therefore fragile.
Instead, preserve the underlying event.
For example:
24 August
720 litres HSD
Plant A
DG-02
stores issue reference
invoice/batch reference
responsible function
timestamp
The regulator may need only a subset.
The EHS team may use it for fuel reconciliation.
The energy manager may calculate equipment performance.
The sustainability team may use it in a GHG inventory.
An assessment or assurance provider may examine the evidence.
The physical event remains unchanged.
This is the difference between:
storing reports
and
storing environmental events.
A mature environmental system should also distinguish between three different classes of data.
This is directly observed from an instrument, test or physical measurement.
Examples:
Water meter reading: 842 m³
Stack PM concentration: X mg/Nm³
Weighbridge quantity: 4,510 kg
Measured data should ideally preserve attributes such as:
A transaction describes an environmental event.
For example:
4.5 tonnes of hazardous waste dispatched from Plant A to Recycler B on 18 September.
The quantity may itself originate from a measurement, but the transaction adds:
Transactions describe movement or activity.
Derived data is produced by calculation.
For example:
Annual Scope 1 emissions = X tCO₂e
or:
Water intensity = X m³ per tonne of product.
Derived metrics depend on:
underlying activity
calculation method
assumptions/factors
boundary
The architecture should therefore preserve the lineage:
This is important because methodologies can change without changing historical physical activity.
If an emission factor is updated, the underlying fuel activity remains valid.
If a reporting framework changes a classification, the historical waste transaction does not need to be reinvented.
If an intensity denominator changes, the source environmental data remains intact.
This separation between fact and interpretation is fundamental to a resilient environmental ledger.
If sustainability-data-readiness is to emerge from daily operations, what should the environmental ledger actually preserve?
This paper proposes a conceptual:
The MEDM is not proposed as another statutory form.
It is a design framework describing the minimum kinds of structured information necessary to preserve environmental events and their lineage.
Every environmental event must belong to a clearly identified source.
Useful fields include:
Without stable identifiers, multi-site aggregation quickly becomes unreliable.
Environmental intensity requires context.
Relevant data may include:
The objective is not to reproduce the entire production ERP inside an environmental system.
It is to preserve enough activity information to interpret environmental performance.
A structured water record may contain:
This allows systems to distinguish a regulatory water limit from a physical water balance.
Useful attributes include:
The primary objective is to preserve activity before it becomes a downstream metric.
A structured waste event may contain:
This allows one transaction chain to support multiple legitimate classifications later.
Relevant attributes can include:
The compliance view and the accounting view can then coexist.
A structured wastewater flow could include:
A quality test and a quantity flow are not interchangeable.
A complete system needs both where relevant.
Every material environmental number should ideally have a path back to its source.
Possible evidence includes:
The essential concept is:
Environmental accounting involves judgement.
The ledger should therefore preserve:
This converts a mutable spreadsheet number into a governed environmental record.
Calling this an "environmental ledger" does not mean physical environmental balances should be treated as financial double-entry accounting.
Physical systems contain uncertainty.
A water balance may contain:
Waste quantities may vary because of:
Emissions measurements also have method and instrument uncertainty.
Therefore, a credible environmental ledger should not force an artificial:
100.000% closure
where the physical system does not support it.
Instead, it should preserve:
measurement
uncertainty
estimation
methodology
residual
explanation
For example, a water balance closing at 97% may be more credible than a manually adjusted spreadsheet claiming 100% closure without explaining how the remaining 3% was resolved.
This principle matters greatly for assurance.
The objective of an environmental ledger is therefore not mathematical perfection.
It is traceable environmental reasoning.
A popular digitisation idea is:
Enter once, report everywhere.
That is attractive but too simplistic.
Different frameworks legitimately:
The better principle is:
Suppose electricity consumption is captured correctly.
That underlying activity may later support:
The original kWh does not need to be recreated for each one.
But the calculations built upon it may legitimately differ.
Likewise, a waste movement is recorded once.
Its regulatory classification and sustainability classification may then be separately mapped.
This architecture is more resilient than building separate databases for every reporting framework.
This proposal needs boundaries.
It is not arguing that environmental compliance should become the complete ESG information system of a company.
Many sustainability topics properly belong elsewhere.
Examples include:
Those should remain in appropriate corporate systems.
This paper concerns the physical environmental layer:
That boundary prevents the environmental accounting ledger from becoming an ESG catch-all.
India's sustainability-disclosure system is itself evolving.
SEBI's BRSR Core framework identifies a defined set of sustainability KPIs and has established a phased applicability structure.
The original 2023 framework set a glide path covering the top 150 listed entities in FY 2023-24, top 250 in FY 2024-25, top 500 in FY 2025-26 and top 1,000 in FY 2026-27.[6]
SEBI subsequently introduced the concept of assessment or assurance and modified aspects of the framework, including value-chain disclosures, through its March 28, 2025 circular.[7]
For the present argument, the important point is not whether a particular organisation uses one assessment or assurance approach.
It is more fundamental:
Suppose a reported annual waste number is 482.6 tonnes.
A reviewer may ask:
Which transactions produced that total?
Suppose annual water consumption is reported.
The next question is:
Which withdrawal and discharge data produced it?
Suppose Scope 1 emissions are calculated.
The question becomes:
Which fuel/activity records and factors produced the figure?
An aggregated spreadsheet is an output.
A credible system should preserve what lies underneath.
BRSR therefore reinforces a question EHS professionals already understand from inspections and audits:
The most obvious objection to this proposal is:
Indian industry already maintains enough environmental records. Why create another requirement?
That objection is valid if MEDM is interpreted as another regulatory return.
It should not be.
The objective is the opposite.
If a hazardous-waste movement already exists as a transaction, its quantity should not need to be independently reconstructed for:
Different outputs may require different calculations or classifications.
But they should increasingly reference the same underlying event.
The future should therefore involve:
less duplicate data entry
not
more environmental bureaucracy.
A proposed environmental ledger has to work for Indian MSMEs.
A complex enterprise platform requiring hundreds of mandatory fields for every activity would fail.
The architecture must be proportionate.
But there is another reality.
A small or medium industrial supplier may never independently publish a BRSR.
It can nevertheless receive environmental-data requests from:
SEBI's 2025 changes made BRSR Core value-chain ESG disclosures voluntary and modified the value-chain framework.[7]
That should prevent the argument from being overstated as a universal regulatory supplier mandate.
But the commercial pass-through of environmental information requirements remains important.
A supplier can therefore find itself answering different customers with different spreadsheets containing variations of the same questions:
electricity?
diesel?
renewable energy?
water?
waste?
emissions?
recycling?
The best response to this problem is not an enterprise-scale ESG bureaucracy for every MSME.
It is lightweight, structured operational data that can be reused.
For smaller facilities, this means designing systems around:
Digital environmental management should reduce administrative burden.
It should not turn EHS officers into data-entry operators.
There is a harder side to this proposal.
Granular environmental information does not merely make reporting easier.
It can reveal things organisations would prefer not to discover.
Imagine a hazardous-waste ledger showing:
Opening stock: 5 MT
Generation: 95 MT
−
Dispatch: 87 MT
=
Expected closing stock: 13 MT
But physical stock is:
8 MT
The system now exposes:
A collection of loosely connected annual documents may hide that inconsistency longer.
A structured ledger surfaces it.
Likewise:
Companies therefore have legitimate concerns around:
These concerns should not be dismissed as resistance to transparency.
They are legitimate data-governance questions.
Any serious environmental data architecture needs rules for:
ownership
role-based access
purpose limitation
correction
version history
retention
confidentiality
regulatory access
Better data creates better management.
It also creates more accountability.
No.
State Pollution Control Boards and Pollution Control Committees have environmental-regulatory mandates.
Those responsibilities should not be blurred by requiring them to operate every corporate sustainability framework.
An SPCB does not need to determine every Scope 2 methodology.
It does not need corporate-governance data.
It does not need to own every ESG calculation.
Interoperability does not require common ownership.
A better principle is:
The regulator uses the attributes required for environmental law.
The company uses the information operationally.
The sustainability function applies appropriate methodologies.
Assessment or assurance providers examine permitted evidence.
Customers receive agreed disclosures.
The same environmental event can serve multiple purposes while institutional roles remain separate.
India does not need to build this architecture from zero.
Important components already exist.
OCEMS demonstrates machine-generated environmental telemetry.
Regulatory portals demonstrate digital filing.
Electronic Consent systems demonstrate digital regulatory workflows.
Hazardous-waste movements already use structured documentation.
Environmental laboratories increasingly generate digital reports.
BRSR has increased the structure of sustainability reporting.
The next question is therefore not:
Should Indian environmental compliance become digital?
Much of the transition has already begun.
The more interesting question is:
That progression can be understood in stages.
Environmental activity is recorded physically.
↓
Paper becomes PDF, image or spreadsheet.
↓
The document or values move into a portal.
↓
The underlying activity receives structured attributes, IDs and evidence.
↓
Water, waste, energy, emissions, production and evidence can be reconciled.
↓
Different regulatory and sustainability calculations use the governed underlying data.
The critical observation is:
A practical evolution path does not require a massive central database.
It can begin with:
Different systems can then remain separate while becoming interoperable.
This architecture has consequences for both people and technology.
A significant part of traditional environmental-compliance work involves:
Those tasks remain necessary.
But environmental professionals are increasingly likely to own questions such as:
The profession therefore moves gradually from:
toward:
That requires a powerful combination of skills:
regulatory interpretation
environmental engineering
mass-balance thinking
data-quality management
assurance awareness
This is likely to become an increasingly important capability inside industrial EHS functions.
Software faces a similar choice.
One approach is to digitise every form individually.
That is useful.
But it risks creating:
digital silos instead of paper silos.
The deeper architecture models the events underneath those forms.
In that model:
Form 3 is not the database.
Form 4 is not the database.
Form V is not the database.
BRSR is not the database.
GRI is not the database.
Forms become views.
Reports become aggregations.
Disclosures become calculations.
Evidence remains attached to the underlying operational activity.
This is a fundamentally different philosophy.
It means building environmental software around:
events rather than forms
lineage rather than final totals
relationships rather than folders
reconciliation rather than year-end reconstruction
Historically, an environmentally compliance-ready facility might have meant:
Required documents can be produced when requested.
Digitisation improved that definition:
Required documents can be produced electronically.
The next stage could be:
Environmental numbers, calculations and evidence can be reconciled continuously.
That changes readiness from:
document availability
to:
A facility can therefore become:
inspection-ready
and increasingly:
sustainability-data-ready
and:
assessment/assurance-ready by design
This does not mean:
Those outcomes involve separate rules, methodologies and judgements.
The environmental ledger provides something more basic.
Environmental regulation and sustainability reporting emerged from different histories and were created for different purposes.
Environmental compliance focuses strongly on:
Environmental accounting increasingly requires:
When a company attempts to move directly from the first system into the second, the missing transformation often appears as an annual spreadsheet exercise.
That is why a facility can be environmentally compliant and still be sustainability-data-unready.
The problem should not be solved by demanding another return.
It should be solved by improving the underlying environmental data architecture.
A litre of fuel should remain a traceable activity before becoming tonnes of CO₂e.
A cubic metre of water should remain part of a physical flow before becoming an intensity metric.
A tonne of waste should retain its generation, storage, movement and destination history before becoming an annual sustainability disclosure.
A monitoring result should remain connected to its source, method and evidence before becoming a compliance conclusion.
This is the transition from:
to:
The goal is not numerical perfection.
Physical systems contain uncertainty.
The goal is transparent, reproducible environmental reasoning.
The goal is not a single database for regulators, sustainability teams and customers.
The goal is interoperability.
The goal is not to turn SPCBs into ESG agencies.
The goal is for the underlying physical event to remain usable by different legitimate systems.
The goal is not another ESG layer that sits above fragmented factory records.
The missing layer needs to exist underneath reporting.
That layer is the:
If Indian industry moves in this direction, a factory should no longer require a sustainability-data rescue exercise at the end of every year.
Normal environmental operations should continuously create the foundation from which regulatory reports, environmental accounts, sustainability metrics and evidence packs can later be produced.
The proposition is therefore simple:
And the design principle behind that future should be:
When that becomes normal, sustainability-data-readiness will no longer need to be created once a year.
It will become a natural consequence of how environmental activity is managed every day.
[1] Global Reporting Initiative - GRI 306: Waste 2020.
Particularly Disclosures 306-3, 306-4 and 306-5 covering waste generated, waste diverted from disposal and waste directed to disposal, including recovery and disposal classifications.
[2] Global Reporting Initiative - GRI 303: Water and Effluents 2018.
The Standard separately addresses water withdrawal, water discharge and water consumption and provides guidance on calculation and contextual methodology.
[3] Greenhouse Gas Protocol - Corporate Value Chain (Scope 3) Accounting and Reporting Standard.
Used in this paper for the general relationship between activity data, emission factors and resulting GHG emissions.
[4] Greenhouse Gas Protocol - Scope 2 Guidance.
Provides guidance concerning electricity activity data and approaches to Scope 2 emissions accounting.
[5] Central Pollution Control Board - Protocols for Online Continuous Effluent & Emission Monitoring Systems (OCEMS), 2018.
Covers system installation, operation, calibration and electronic data submission for online continuous monitoring.
[6] Securities and Exchange Board of India - BRSR Core framework, Circular dated 12 July 2023.
Established the original phased BRSR Core applicability path: top 150 listed entities for FY 2023-24; top 250 for FY 2024-25; top 500 for FY 2025-26; and top 1,000 for FY 2026-27.
[7] Securities and Exchange Board of India - Circular dated 28 March 2025, “Measures to facilitate ease of doing business with respect to framework for assurance or assessment, ESG disclosures for value chain, and introduction of voluntary disclosure on green credits.”
Relevant to the paper's references to assessment or assurance and the revised treatment of value-chain ESG disclosures.
[8] Ministry of Environment, Forest and Climate Change - Hazardous and Other Wastes (Management and Transboundary Movement) Rules, 2016, as amended.
Primary Indian legal framework referred to in discussion of hazardous-waste records, movement and annual reporting.
This paper deliberately distinguishes statutory environmental compliance from sustainability accounting.
It does not suggest that BRSR, GRI, GHG accounting or sustainability-reporting frameworks replace obligations under Indian environmental law.
It does not claim that maintaining the proposed environmental ledger automatically makes an organisation compliant with any disclosure framework, certification standard or carbon-market methodology.
The Minimum Environmental Data Model (MEDM) presented in this paper is a conceptual framework proposed by the author to stimulate discussion around environmental data architecture. It is not an existing Indian regulatory standard.
The examples are intended to demonstrate information architecture and should not be interpreted as universal regulatory requirements for every facility or industry.
Harshal T. Gajare works at the intersection of industrial environmental compliance, environmental data and digital systems.
Through EHSSaral, his work explores how Indian industries can move beyond fragmented registers, spreadsheets, reports and annual reconstruction toward structured, traceable and evidence-linked environmental information.
His focus is on a practical question:
How can the environmental work industries already perform every day create a more reliable data foundation for compliance, audits and future sustainability requirements?
EHSSaral Research examines structural and practical challenges in Indian environmental compliance.
Its work focuses on the intersection of environmental regulation, industrial operations, environmental data and technology-with particular attention to how environmental information is generated, reconciled and used in real factories.
The objective is not merely to explain existing regulations, but to examine how environmental-compliance systems may need to evolve as Indian industry becomes increasingly digital, accountable and data-intensive.
Environmental compliance focuses on meeting legal conditions, limits, authorisations and reporting obligations. Environmental accounting tracks physical environmental activity-such as water, energy, waste and emissions-across a defined reporting boundary and period.
No. Compliance records may provide important source data, but BRSR reporting can require aggregation, classifications, boundaries, intensities, methodologies and evidence lineage that are not automatically created by regulatory records.
An environmental accounting ledger is a structured record of environmental measurements, transactions, calculations, methodologies and evidence across areas such as water, energy, emissions and waste.
Sustainability data debt is the future reporting and verification burden created when environmental activity is not captured with enough granularity, context or evidence when it occurs.
No. Pollution-control regulators and sustainability-reporting systems serve different purposes. The opportunity is to make underlying environmental data more structured and interoperable, not turn SPCBs into ESG reporting agencies.

Founder, EHSSaral
Founder - EHSSaral | Partner - Perfect Pollucon | ISO 14001 Lead Auditor | GHG Protocol Scope 2 | Chemist | Data Scientist | Second-generation environmental professional simplifying EHS compliance for Indian industries through practical, automated, tech-enabled, data driven compliance workflows.
Form 4 vs Form 5: Why Hazardous Waste Numbers Don't Match
EBWGR Certificate: Eligibility, Process, Cost & Records
Bio-Medical Waste Management for Non-Hospitals (India) | EHSShala
Environmental Compliance for Pharmaceutical Manufacturing in India | EHSSaral
 EHSSaral v1.png)
EADA Random Audit Assignment: Factory Readiness Guide (2025) | EHSSaral
Rule 9 Hazardous Waste Utilization: Why Applications Fail (2023–2025) | EHSSaral Research
Used Oil & Waste Oil Management in India - Factory & EHS Guide | EHSShala
 Practical Guide for Indian Factories EHSShala.webp)
Hazardous Waste Management Rules in India: Forms, Storage & Compliance

Why EHS Experience Is Being Filtered Out - The Real Hiring Logic | EHSSaral

Can You Transfer Hazardous Waste Responsibility in India? (What the Law Says)