ehssaral.webp)
50 mg/Nm³ Emission Limit in India: Is Your Chimney Ready? (SME Guide)
scrubber vs baghouse 50 mg/Nm3 emission limit stack emission compliance CPCB emission norms boiler particulate limit India
Last updated:
|3 Mar 2026
Read time: 15 min read
A Practical Survival Guide for Indian SMEs
Quick Summary (For Busy Plant Heads)
50 mg/Nm³ is a system capability issue, not a paperwork issue.
Many existing scrubbers designed for 150 mg struggle to consistently achieve 50 mg.
Fabric filters (baghouses) are increasingly becoming standard for high-load operations.
OPEX (power cost) may rise along with CapEx.
Waiting for enforcement clarity can increase retrofit costs.
A baseline audit today prevents emergency redesign tomorrow.
📌 Key Takeaways (Read This First)
Systems built for ~150 mg/Nm³ were not engineered for consistent 50 mg/Nm³ performance.
If your last stack result is 80–120 mg/Nm³, you’re not “failing” - you’re in the exposure zone where calm upgrades are still possible.
Tighter limits often increase pressure drop → fan load → monthly power cost (OPEX pain).
“Add more filter bags” can worsen emissions if air-to-cloth ratio and housing distribution stay wrong.
If CEMS is installed, sensor drift and moisture effects that were invisible at 150 mg become visible at 50 mg.
The best time to act is before vendor queues and retrofit prices spike.
The Translation: What 50 mg/Nm³ Means at Your Stack
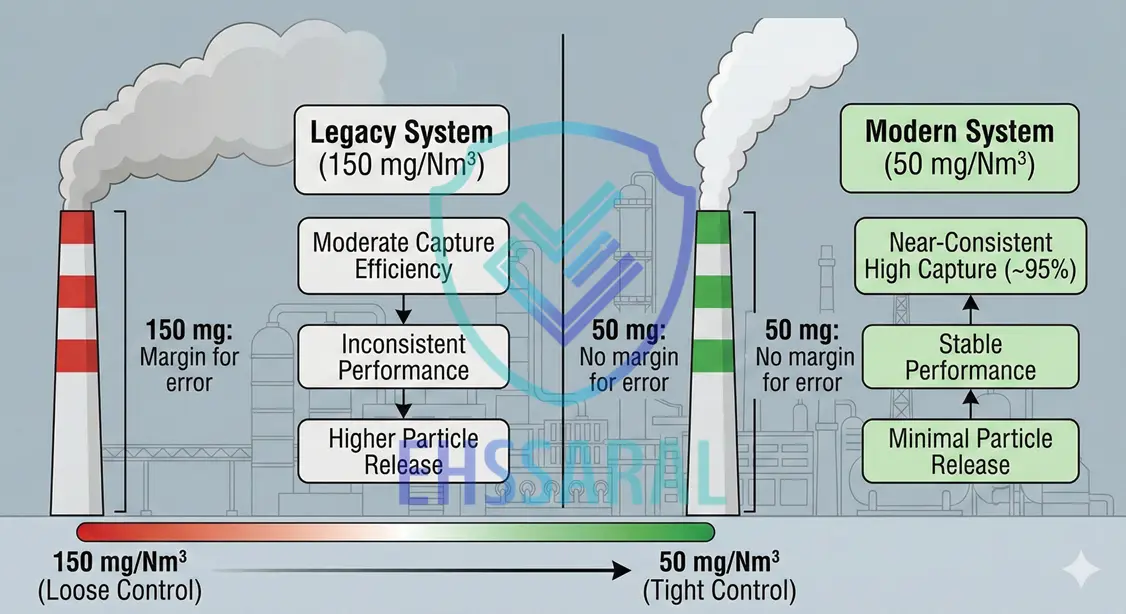
In many Indian plants, emission control systems were designed during a period when 150 mg/Nm³ was considered manageable and compliant.
Those systems were engineered with reasonable capture efficiency in mind - not extreme consistency.
Moving to 50 mg/Nm³ changes the engineering expectation.
It is not just about achieving one compliant test report.
It is about maintaining near-consistent high capture efficiency during real production loads - fluctuations, start-ups, shutdowns, and peak operation included.
From a practical standpoint:
If your current stack report shows readings between 100–140 mg/Nm³, your system is not “slightly off.”
It is operating in a completely different efficiency band.
Best Stack Emission Monitoring Service Provider
What mg/Nm³ Means (In Practical Terms)
“mg/Nm³” is milligrams of particulate matter per normal cubic meter of gas.
“Normal” means readings are adjusted to standard temperature and pressure so comparisons are fair.
But plant conditions aren’t “normal.”
Gas temperature, moisture, and production load vary every day.
At 150 mg, these fluctuations often went unnoticed.
At 50 mg, they become critical.
Why Limits Are Tightening
In many clusters, emission control is being evaluated more as performance over time than a one-time test result.
Urban expansion, complaint sensitivity, and tighter board scrutiny have pushed expectations toward lower particulate levels.
The practical effect is simple: consistency is becoming the benchmark, not isolated compliance.
Which Units Should Pay Immediate Attention
Not every industry will experience the same technical challenge.
But certain categories should proactively evaluate their systems:
Boiler-based manufacturing units
Biomass or petcoke-fired systems
Foundries and metal melting units
Chemical plants with particulate carryover
Spray dryers and high-temperature process vents
High-load furnaces
Fuel type matters significantly.
Achieving 50 mg/Nm³ in a PNG-fired system is a different engineering problem compared to biomass or petcoke firing.
In many biomass-fired boilers, particulate loading is inherently higher.
That changes filtration strategy entirely.
If You’re Wondering “How Do We Reach 50 mg/Nm³?” Start Here
Most plants don’t fail because they don’t have equipment.
They fail because they don’t know their true baseline at normal load.
Before you change hardware, first confirm:
Your last test was done at real operating load (not a comfortable low-load day)
Your system has stable DP / flow / fan load patterns
Your sampling point and ports are compliant and usable (so results don’t get disputed)
This one step alone prevents wrong CapEx decisions.
Why “Business As Usual” Will Not Work
In day-to-day operations, emission control systems often receive attention only during inspection or annual testing.
This is where vulnerability builds.
The Scrubber Comfort Zone
Across many SME plants, common patterns are visible:
Differential pressure (DP) not logged regularly
Recirculation pumps operating inconsistently
Packing media partially choked
Mist eliminators poorly maintained
Testing conducted at partial production load
A system may pass once.
It may not pass consistently.
At 50 mg/Nm³, consistency becomes the real test.
Inspection Is Becoming Performance-Oriented
Inspection dynamics have subtly changed.
Instead of only reviewing the latest test report, officers increasingly look at:
Maintenance logs
Variation between past emission reports
Production load during sampling
Calibration records (where applicable)
Stack accessibility and sampling compliance
If readings fluctuate significantly between reports, re-sampling is more likely.
This is not about fear.
It is about operational transparency becoming standard.
The CEMS Headache at 50 mg
For units operating with Continuous Emission Monitoring Systems (CEMS), the tightening to 50 mg/Nm³ introduces another layer of complexity.
At 150 mg, minor optical drift in sensors often remained unnoticed.
At 50 mg, the same drift becomes visible.
Moisture interference, probe fouling, and calibration inconsistencies begin to trigger alarms more frequently.
From a practical standpoint:
A slight misalignment in calibration can show non-compliance.
Sensor lens contamination can exaggerate readings.
Fluctuating moisture levels can distort particulate measurements.
In many Indian plants, CEMS is installed - but preventive calibration discipline is still evolving.
When limits tighten, instrumentation quality becomes as important as filtration quality.
The SME Pain Point: What This Really Means Financially
This is where most plant heads pause.
Because the conversation shifts from environmental discussion to capital planning.
Moving from 150 to 50 mg/Nm³ is rarely a “change the filter cartridge” exercise.
It is often a system conversation.
Why It’s Not Just a Filter Replacement
At tighter limits, engineering margins shrink.
Here is what typically changes:
| Design Parameter | What Changes at 50 mg/Nm³ |
|---|---|
| Capture efficiency | Must approach ~95% consistently |
| Gas velocity | Needs tighter control |
| Filtration area | Often undersized in legacy systems |
| Pressure drop | Increases |
| Fan capacity | May require upgrade |
| Power consumption | Monthly electricity cost increases |
Higher pressure drop means higher resistance.
Higher resistance means larger fan load.
Larger fan load means higher electricity consumption.
For many SMEs, recurring power bills are more stressful than one-time CapEx.
This is why planning matters.
Retrofit vs Redesign - Understanding the Scenarios
From field experience, transitions usually fall into three categories:
Scenario 1: Minor Upgrade
Low production load
Existing readings already below 80 mg
Mechanical system in good condition
In such cases, optimization and tuning may be enough.
Scenario 2: Hybrid Solution
Existing scrubber required for acid gas control
Add polishing filtration stage
Fan resizing may be needed
This balances chemistry control with particulate reduction.
Scenario 3: Full System Redesign
High and consistent production load
Readings currently above 100 mg
Undersized housing
Structural velocity imbalance
In such cases, baghouse systems often become the practical choice.
Each case is different.
The mistake is assuming all systems fall into Scenario 1.
The Baghouse Shift: Why Fabric Filters Are Becoming Standard
Across industrial clusters, there is a gradual shift toward fabric filtration systems - especially for high-load operations.
This is not a trend driven by fashion.
It is driven by physics.
Scrubber vs Baghouse - Practical Comparison
| Parameter | Wet Scrubber | Baghouse |
|---|---|---|
| PM removal efficiency | Moderate | High |
| 50 mg consistency | Difficult at high load | Achievable |
| Water usage | High | None |
| Sludge handling | Required | Minimal |
| Maintenance style | Fluid system | Mechanical filtration |
| Power impact | Pump + Fan | Primarily fan |
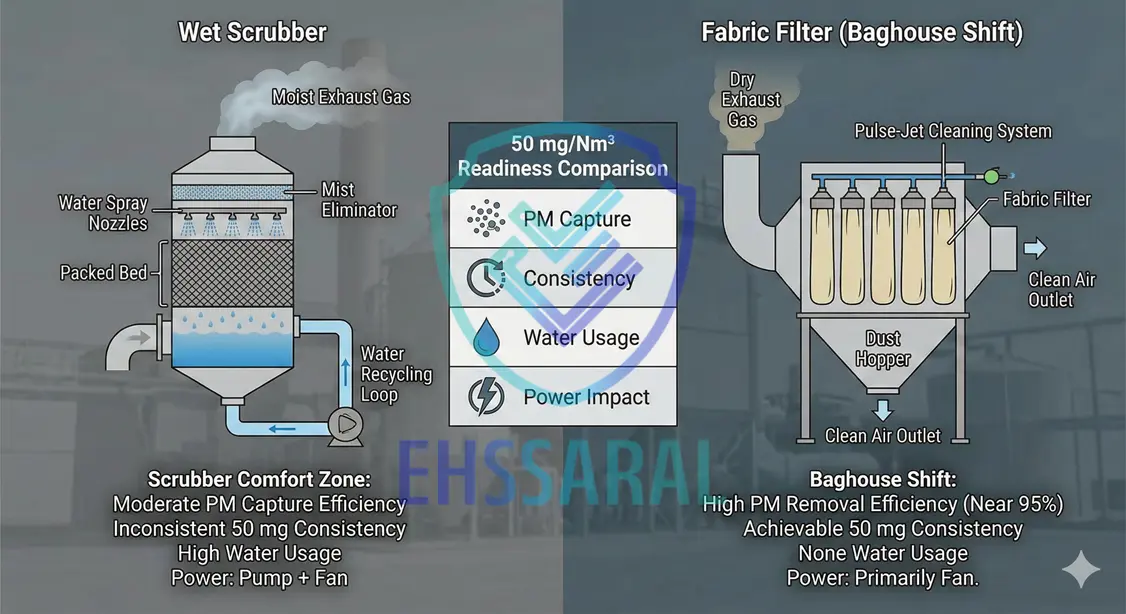
Wet scrubbers remain effective for certain applications.
But when particulate concentration is high and consistency is required, fabric filters provide tighter control.
Can You Keep Your Scrubber? A Practical Decision Framework
This is the question most plant heads quietly ask.
Before making any decision, evaluate:
Step 1: Do you control acid gases (SOx, chlorine vapors)?
If yes → Scrubber may still be required. Consider adding a polishing filtration stage.
If no → Evaluate if a filtration-based system is technically feasible.
Step 2: Is your system running consistently above 70% load?
If yes → Filtration-based system often provides more stable control.
If no → Scrubber optimization may be workable.
Step 3: What do your last readings show?
Below 60 mg → Comfortable zone.
60–80 mg → Optimization possible.
80–120 mg → Exposure zone.
Above 120 mg → Engineering redesign likely required.
This framework reduces emotional decision-making.
It converts uncertainty into structured evaluation.
The Timeline Trap: Why “Wait and Watch” Is Risky
Many SMEs prefer to wait for full enforcement clarity before investing.
From a practical standpoint, this can create its own risk.
When enforcement tightens:
Equipment vendors get booked quickly.
Fabric filter suppliers extend delivery timelines.
Installation slots become limited.
Prices rise due to demand surge.
In many industrial clusters, once 10 units begin upgrading, the next 50 follow rapidly.
Planning early gives negotiating power.
Waiting reduces options.
The Hidden Factor: Habitation Buffer & Expansion Risk
Stack performance is no longer isolated from broader compliance considerations.
300–500 Meter Sensitivity in Urban Clusters
As cities expand, many industrial units now find themselves closer to residential areas than they were a decade ago.
In such scenarios:
Complaint-driven inspections increase.
Emission visibility becomes sensitive.
Local scrutiny intensifies.
Stack compliance becomes part of public perception.
Why This Affects Expansion Plans
When applying for:
Capacity enhancement
Consent renewals
Environmental clearance amendments
Authorities increasingly review historical performance.
A unit consistently struggling near limit values may face more questions during expansion proposals.
Stack performance is becoming part of long-term operational strategy - not just annual compliance.
Common Mistakes We See on the Ground
Over the years, certain patterns repeat themselves across industries.
Not because plant teams are careless - but because systems were never originally designed for tighter performance margins.
Here are three situations that illustrate the risk clearly.
Mistake 1: “We’ll Just Add More Filter Bags”
A mid-sized foundry faced rising particulate readings.
Their response was straightforward: increase the number of filter bags inside the existing housing.
On paper, more bags should mean better filtration.
In reality:
Housing dimensions remained unchanged.
Air-to-cloth ratio was still misaligned.
Gas distribution stayed uneven.
Bags began clogging faster.
The emission readings actually increased.
The root cause was not bag quantity.
It was system velocity balance and fan capacity.
At 50 mg/Nm³, partial upgrades often create new imbalances.
Mistake 2: “We’ll Test at Lower Production Load”
This is common in boiler-based systems.
Testing is scheduled when production is moderate.
Emission readings come within acceptable range.
But production logs show peak load on most working days.
When inspectors compare:
Test load vs operational load
Fuel consumption vs test day fuel rate
Questions arise.
At tighter limits, alignment between test conditions and normal operations becomes important.
Compliance is increasingly viewed as a performance trend - not a single data point.
Mistake 3: Ignoring Pressure Drop Trends (DP)
 ehssaral.webp)
Pressure drop tells you what your system is becoming - weeks before your stack test tells you.
A common pattern looks like this:
Week 1: DP = 2.5 mmWC (normal)
Week 6: DP = 4.8 mmWC (team assumes “dustier week”)
Week 10: DP = 6.9 mmWC (still no corrective action)
Week 12: Peak production starts → fan load increases → flow distribution worsens
Then a stack test happens in the same window.
Result: readings spike beyond comfort.
The system gave early warnings for weeks.
Nobody logged them consistently.
At 50 mg/Nm³, DP trend discipline is not optional. It’s the difference between calm maintenance and sudden panic.
A Practical Self-Assessment Before the Inspector Visits
Instead of asking “Are we compliant?”, a better question is:
“Is our system stable?”
Consider evaluating the following:
Do the last three stack test reports show less than 15% variation?
(If variation is high, inspectors often read it as instability - not just sampling noise.)Is differential pressure (DP) logged weekly?
(If DP climbs from ~3 to ~7 mmWC over a few weeks with no action, you are designing for failure during peak load.)Is the sampling port compliant and easily accessible?
Are fan motor loads documented?
Is preventive maintenance scheduled and recorded?
If CEMS is installed, are calibration logs updated and traceable?
Now interpret this practically:
0–2 weak areas → System appears stable.
3–5 weak areas → Internal audit recommended within 30 days.
More than 5 weak areas → Engineering evaluation should not be delayed.
This is not about passing inspection.
It is about reducing operational unpredictability.
If you want a structured way to do this without chasing files and reminders, EHSShala/EHSSaral can help you convert this into a simple system:
Store last test reports in one place
Track DP/logbook discipline as recurring tasks
Keep a “pre-inspection readiness score” updated month by month
Clarity at the system level avoids confusion later.
A Final Perspective
The shift to 50 mg/Nm³ should not be viewed as a regulatory burden alone.
It is an engineering maturity checkpoint.
If your last stack report shows:
Below 60 mg → You are comfortable.
60–80 mg → You have optimization room.
80–120 mg → You are exposed but not failing.
Above 120 mg → Begin structured redesign planning.
In many Indian plants, compliance pressure builds gradually - then suddenly.
Systems that evolve calmly adapt without stress.
Systems that wait react under pressure.
From a practical standpoint, early evaluation costs less than emergency retrofits.
Clarity at the engineering stage prevents confusion at the inspection stage.
Based on field observations across Indian boiler and process industries.
FAQs
1) Is 50 mg/Nm³ achievable with a wet scrubber?
Sometimes - but it depends on load profile, particulate characteristics, and whether the scrubber is also required for acid gas control. Many high-load systems shift to baghouse or hybrid polishing stages for consistency.
2) If my report shows 90 mg/Nm³, am I non-compliant?
You may not be failing today, but you are in the exposure zone. This is the best time to do a baseline audit and plan upgrades calmly.
3) Why does power cost increase when targeting lower particulate?
Lower limits often require higher pressure drop across control equipment, which increases fan load and electricity consumption.
4) Can adding more filter bags reduce emissions?
Not always. If air-to-cloth ratio, housing distribution, and fan capacity remain wrong, adding bags can increase clogging and worsen performance.
5) What changes when CEMS is installed and limits drop to 50 mg/Nm³?
At lower thresholds, optical drift, moisture interference, and calibration discipline become much more visible. Small issues can trigger frequent alarms.
6) What’s the first step before spending CapEx?
Confirm your true baseline at real operating load, then assess DP trends, fan load margin, and system stability. Baseline first, hardware second.

Harshal T Gajare
Founder, EHSSaral
Founder - EHSSaral| Partner - Perfect Pollucon | ISO 14001 Lead Auditor | Second-generation environmental professional simplifying EHS compliance for Indian manufacturers through practical, tech-enabled guidance.
Related Blogs
 EHSSaral v1.png)
Blue Category MPCB 3-Year Consent Validity for Recyclers (2026) | EHSSaral
 Practical Guide for Indian Factories EHSShala.webp)
Hazardous Waste Management Rules (2016) – Practical Guide for Indian Factories | EHSShala

E-Waste Management Rules (2022) in India - Practical Guide for Factories | EHSShala
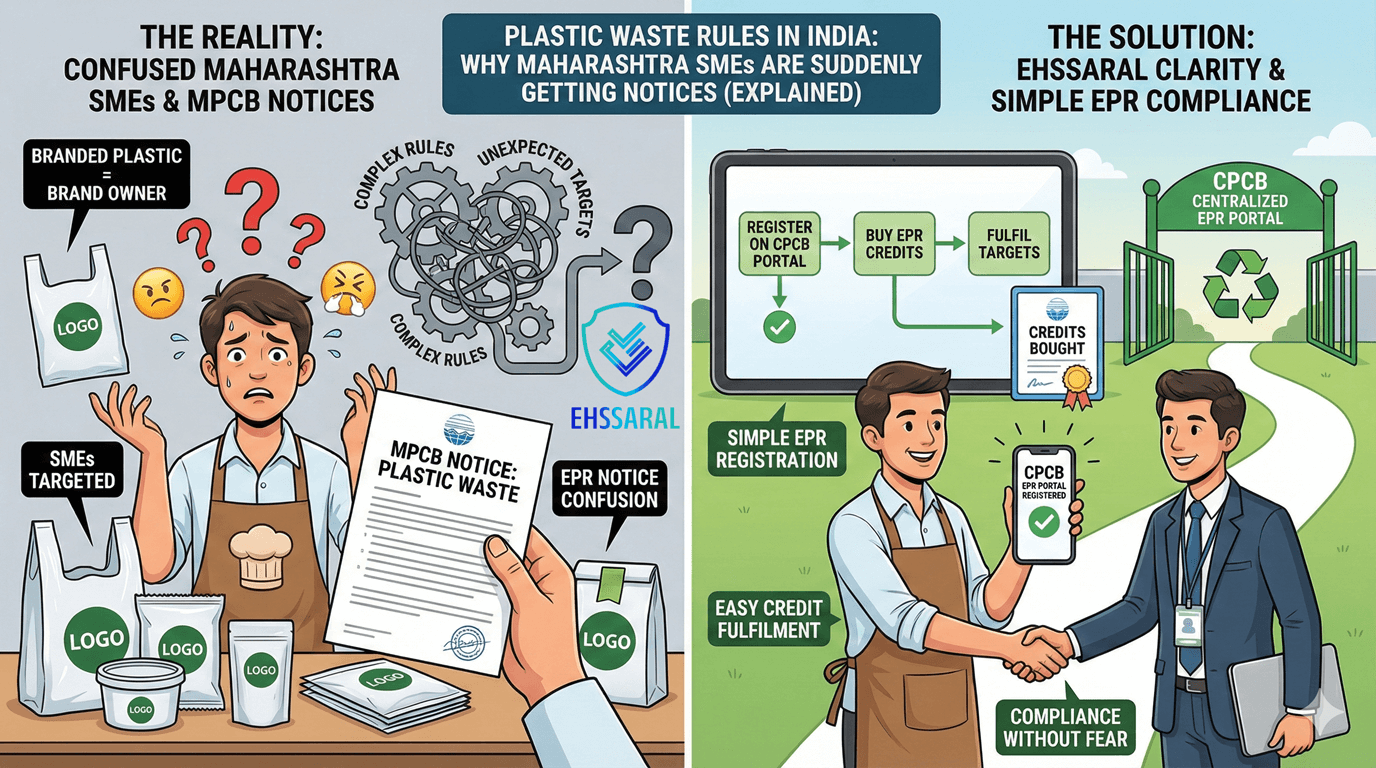
Maharashtra SME Plastic Waste EPR Guide: Are You a Brand Owner | EHSSaral
 List, Rules & Compliance Guide ehssaral.webp)
Orange Category Industries in India (2026): List, Rules & Compliance Guide
How EHS Managers Can Verify EPR Credits Before Audit (DIY Guide) | EHSSaral
Environmental Compliance for Pharmaceutical Manufacturing in India | EHSSaral

Form 5 Environmental Statement India: Example & Mistakes