
EHSShala
Environmental Calendar from Consent Conditions (Practical Guide) | EHSShala
EHSSaral is an Environmental Compliance Intelligence Platform for Industries. Consent Intelligence • Alerts & Tasks • Incident Reporting • Form IV & V • Audit-Ready Records
See how EHSSaral works
24 Aug 2026
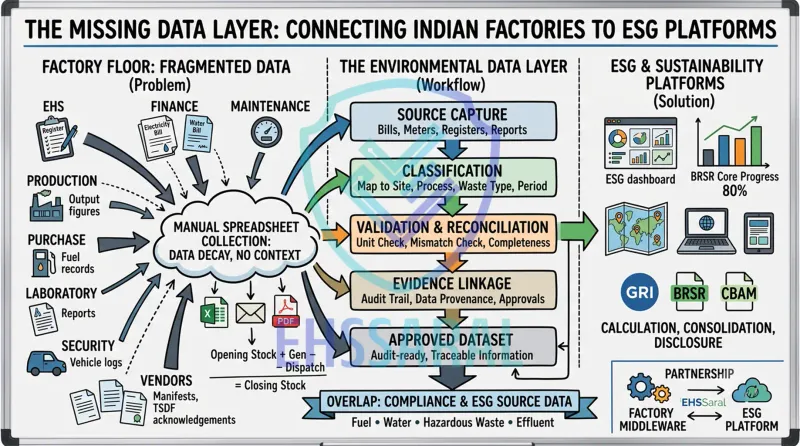
Indian factories generate environmental data across meters, bills, registers, manifests, laboratory reports and multiple departments. This article explains the missing data layer needed to convert these fragmented records into structured, validated and traceable information for ESG reporting.
India now has capable ESG platforms, carbon calculators and sustainability-reporting tools. The less visible challenge is converting everyday factory records into consistent, reviewed and evidence-linked environmental data that these systems can use with confidence.
Consider a familiar situation.
A corporate sustainability team requests annual water, electricity, fuel, emissions and waste data from five manufacturing sites.
At each site, the EHS officer begins another collection exercise. Finance is asked for utility bills. Maintenance shares meter readings. Production provides output figures. Purchase sends fuel records. Laboratory reports are located in emails. A hazardous-waste transporter is contacted for a missing acknowledgement. Some information remains in physical registers, while other records are spread across spreadsheets and departmental folders.
After several rounds of follow-up, the numbers are entered into the ESG platform.
The dashboard is ready. But how dependable is the information beneath it?
This is not necessarily a weakness in the ESG platform. Most ESG systems are designed to calculate, consolidate, analyse and disclose information after it has been collected. The real difficulty usually sits upstream-between daily factory operations and the corporate reporting system.
That space is the missing environmental data layer.
A sophisticated ESG calculator cannot remove uncertainty from incomplete factory records. If the underlying water, waste, fuel or production information is unexplained, the corporate dashboard may consolidate that uncertainty rather than resolve it.
The environmental data layer is the combination of systems and processes that converts factory activities into structured, traceable and reporting-ready information.
In simple terms, it connects six stages:
Factory activity → Source record → Classification → Validation → Approval → ESG calculation and disclosure
Suppose an ESG platform requires the annual hazardous-waste quantity generated by a factory.
The final figure cannot be understood properly as an isolated spreadsheet entry. It may have been derived from:
The annual total is only the final output. The environmental data layer preserves how that total was established.
This does not mean that every environmental parameter needs to be monitored in real time.
Meter readings may be recorded daily. Waste movement is event-based. Electricity bills arrive monthly. Laboratory monitoring may happen monthly, quarterly or at another prescribed frequency. Regulatory returns may be annual.
The requirement is not continuous data for its own sake. The information should be:
This is the difference between merely collecting values and building dependable environmental data.
Read more about Environmental Compliance vs Environmental Accounting in India and How EHSSaral can fill this gap
An ESG report may present environmental performance through a relatively small number of metrics. Inside a factory, however, those metrics originate from several departments, records, instruments and outside organisations.
An annual electricity figure may begin with utility bills held by finance. DG fuel consumption may involve purchase invoices, tank readings and equipment logs. Water withdrawal may come from borewell meters, municipal bills and tanker records. Hazardous-waste quantities may require information from the EHS team, stores, security, transporters and disposal facilities.
Data ownership is therefore distributed.
In many Indian plants:
An annual ESG template sent only to the EHS department does not automatically connect these records.
The EHS officer often becomes the person responsible for compiling information that is operationally owned by several other departments. This creates repeated follow-ups and makes the process dependent on individual coordination.
The challenge becomes more complex across multiple sites. Different factories may use different names, units, cut-off dates and calculation methods for the same environmental parameter.
For example, one factory may report water withdrawal in kilolitres from daily meter readings. Another may calculate monthly consumption using borewell operating hours. A third may combine municipal bills with tanker invoice quantities.
All three values may appear under one corporate heading called “water consumption,” even though their measurement basis is different.
This is where confusion usually starts.
Spreadsheets remain useful in Indian plants. They are flexible, familiar and easy to exchange.
The problem begins when a spreadsheet is expected to function as the entire environmental data-management system.
In many organisations, the annual process follows a familiar pattern:
A spreadsheet cell can contain “1,240 tonnes,” but it may not explain:
The number remains, but its operating context gradually disappears.
This can be described as data decay. Each time a figure is copied from a register into a departmental spreadsheet, then into a corporate template and finally into an ESG platform, part of its origin and meaning may be lost.
If the employee who prepared the workbook changes roles or leaves the organisation, the calculation logic may leave with that person.
During an internal review, assessment or assurance exercise, another employee may be able to locate the final number but may struggle to reconstruct how it was derived.
One of the largest opportunities for Indian industries lies in the overlap between environmental compliance and ESG reporting.
A factory may already collect information about electricity, fuel, water, effluent, emissions, waste and production for:
These processes may request the same underlying data through separate templates.
| Factory-level record | Environmental compliance use | ESG or sustainability use |
|---|---|---|
| Electricity consumption | Operational and consent-related review | Energy consumption and Scope 2 input |
| Fuel consumption | DG, boiler and furnace records | Energy and Scope 1 input |
| Water withdrawal | Consent compliance and water balance | Water-withdrawal disclosure |
| ETP readings | Treatment performance and discharge review | Effluent and water-management indicators |
| Hazardous-waste register | Form 3 and storage control | Waste generated by category |
| Form 10 and weighbridge records | Waste movement and disposal trail | Waste sent for recycling, recovery or disposal |
| TSDF acknowledgement | Disposal evidence and annual-return support | Evidence supporting final treatment route |
| Stack-monitoring report | Emission-limit compliance | Environmental performance evidence |
| Production quantity | Consent capacity and operational review | Energy, water, emission or waste intensity |
| Form V information | Environmental statement | Input to multiple environmental disclosures |
This overlap does not mean that the final compliance and ESG figures will always be identical.
Reporting boundaries, classifications, exclusions and periods may differ. Form V may follow one prescribed structure while a corporate ESG framework uses another definition. A sustainability report may cover a group of facilities, while a regulatory return applies to one authorised unit.
Different figures can therefore be legitimate.
For example, a regulatory record may report fresh-water withdrawal, while a sustainability indicator may separately include recycled water. One system may follow the financial year and another a calendar year.
The problem is not necessarily that the figures differ. The problem is being unable to explain the difference.
A factory should not have to collect the same environmental information separately for compliance, ESG, carbon accounting and management reporting.
A shared source-data layer can support different outputs while preserving the definition, period, boundary and calculation method used for each one.
Providing an upload portal or digital form does not automatically create reliable environmental data.
A useful factory-side data layer needs to perform several connected functions.
Every record should be associated with the correct:
Consider a description such as “sludge.”
At one site, this may refer to ETP sludge. At another, it may refer to paint sludge, oil-containing residue or a process-specific hazardous waste.
If all these entries are consolidated under one generic category without checking their classification, the corporate total may become misleading.
The same environmental information may be recorded in:
Unit conversion should preserve:
Replacing the source value with a converted number makes later review more difficult.
The system should identify whether expected records are missing.
Examples include:
Completeness is especially important when annual values are assembled from monthly or event-based records. Eleven electricity bills cannot quietly become a twelve-month total.
Environmental quantities are rarely independent. Many can be compared through operational relationships.
Examples include:
A difference does not automatically prove that a record is incorrect. It indicates that the connected records require review.
The objective is not automatic rejection. It is early visibility.
The approved figure should remain connected to the bill, register, laboratory report, manifest, certificate or calculation from which it was derived.
This traceability is commonly described as data lineage or data provenance: the ability to explain where a reported value originated, how it was classified or calculated, what evidence supports it and who reviewed it.
As BRSR Core coverage expands, this supporting trail becomes increasingly important. SEBI’s current framework provides for assessment or assurance of BRSR Core on a progressive glide path reaching the top 1,000 listed entities by FY 2026–27. Value-chain ESG disclosures for the top 250 listed entities are voluntary from FY 2025–26, with assessment or assurance of those value-chain disclosures voluntary from FY 2026–27. Refer to SEBI’s March 2025 circular.
This does not mean that every Indian supplier is directly subject to BRSR Core.
However, suppliers to larger companies may increasingly receive structured environmental information requests from customers. A supplier that can provide source-traceable data will be better placed to respond than one that has to reconstruct annual figures each time.
Environmental data may pass through several hands before reaching the corporate ESG system.
A plant-level approval process should make it clear:
This prevents an unreviewed draft figure from being treated as a final corporate number.
Hazardous-waste reporting provides a useful example of why final-value collection is not enough.
Suppose the corporate ESG team receives the following table from a factory:
| Waste category | Generated | Dispatched | Closing stock |
|---|---|---|---|
| ETP sludge | 42.5 tonnes | 38.0 tonnes | 6.5 tonnes |
The table appears straightforward. At the factory level, however, these figures may depend on several connected records:
A basic quantity relationship is:
Opening stock + waste generated − waste dispatched = closing stock
Consider the following records:
| Quantity | Tonnes |
|---|---|
| Opening stock | 2.0 |
| Waste generated during the year | 42.5 |
| Waste dispatched during the year | 38.0 |
| Expected closing stock | 6.5 |
The quantities appear to reconcile.
However, a meaningful review should go further.
The 38 tonnes recorded as dispatched should be checked against the relevant manifests, gate passes and weighbridge records. Disposal or recycling evidence should be available where applicable. The calculated closing stock should be compared with the quantity physically present at the reporting cut-off.
The waste description and category should also remain consistent across:
Now suppose the physical closing stock is measured as 7.1 tonnes rather than 6.5 tonnes.
The difference is 0.6 tonnes.
That mismatch is not automatically evidence of incorrect reporting or non-compliance. There may be several possible explanations:
A useful environmental data system should flag the difference for review. It should not silently alter the quantity or automatically label the factory non-compliant.
The responsible person can then examine the records, document the reason and approve the appropriate figure.
This is the distinction between data collection and environmental data intelligence.
The corporate ESG platform may require only the final approved waste values. The factory-side system needs to preserve how those values were constructed and why any difference was accepted or corrected.
A connected Hazardous Waste Management System like EHSSaral should preserve the relationship between generation, storage, dispatch, acknowledgement and annual reporting.
Water data creates a similar challenge.
A simplified factory water chain may look like this:
Water withdrawn → Water consumed → Effluent generated → Effluent treated → Water reused or discharged
But each stage may be maintained through a different source.
| Water stage | Possible source |
|---|---|
| Groundwater withdrawal | Borewell meter |
| Municipal water | Utility bill |
| Tanker water | Purchase invoice and gate record |
| Process consumption | Submeter or department-wise allocation |
| Domestic consumption | Meter reading or estimated allocation |
| Effluent generation | ETP inlet meter |
| Treated effluent | ETP outlet meter |
| Reuse | Reuse-line meter |
| Final discharge | Outlet meter |
| Production quantity | Production register or ERP |
The records may not align perfectly.
Meter-reading times can differ. A flow meter may remain faulty for several days. Tanker quantities may be based on invoice capacity rather than measured receipt. Domestic consumption may be estimated. Evaporation and cooling losses may not be directly metered.
A good data system should preserve these limitations rather than creating false precision.
It should distinguish whether a value was:
This helps the sustainability team understand the quality and limitations of the final number instead of receiving an unexplained annual total.
A reasonable question is whether this missing layer is simply an ERP integration or IoT problem.
These systems are useful, but they solve different parts of the environmental data chain.
An ERP may contain purchases, invoices, production quantities and material movements.
It may not manage:
ERP information can be an important source, but it is not automatically a complete environmental dataset.
Sensors can generate frequent readings and reduce manual entry.
They do not independently determine:
Automated data still needs environmental context.
A document repository can preserve bills, manifests, certificates and reports.
It may not connect each document with:
Storing a document and understanding what it supports are different functions.
ESG platforms are generally strongest at:
They may not be designed to manage every factory-specific environmental workflow or state-level compliance record.
The factory-side environmental data layer connects these systems. It does not need to replace them.
Environmental data management in Indian manufacturing cannot be designed only from a corporate questionnaire.
In day-to-day operations, factories may deal with:
Even two factories belonging to the same company may follow different internal processes.
One site may have digital water meters and dedicated environmental staff. Another may use manual logbooks and assign environmental responsibilities to a utility or safety engineer.
One factory may receive TSDF records electronically. Another may depend on physical documents and periodic vendor follow-up.
A practical system must accommodate these operating differences while keeping the final data structure consistent.
This does not mean accepting inconsistent definitions. It means separating the method of data capture from the structure required for reporting.
A generic annual questionnaire can request the final value. It cannot, by itself, establish the operational chain behind that value.
A practical factory environmental data architecture can be understood through five layers.
| Layer | Main purpose | Typical examples |
|---|---|---|
| Source capture | Collect original operational records | Bills, registers, meters, manifests and laboratory reports |
| Classification | Add environmental and reporting context | Site, process, waste type, period and unit |
| Validation | Check completeness and connected quantities | Missing records, unusual changes and reconciliations |
| Evidence and approval | Preserve review and traceability | Source documents, comments, approvals and version history |
| Distribution | Provide approved data to its users | ESG platforms, compliance returns and management reports |
The ESG platform does not necessarily need to rebuild all five layers.
It can receive reviewed plant-level information from a specialised environmental compliance system and continue with corporate consolidation, emission calculations, benchmarking and disclosure.
The responsibilities are complementary.
| Factory-side environmental data layer | ESG and carbon platform |
|---|---|
| Captures plant-level records | Consolidates enterprise-level information |
| Understands local environmental workflows | Applies disclosure and accounting frameworks |
| Maps consent and compliance requirements | Manages corporate reporting structures |
| Reconciles connected quantities | Calculates emissions and sustainability indicators |
| Identifies missing records and evidence | Provides analysis and dashboards |
| Maintains site-level review trails | Supports corporate assessment and assurance |
| Preserves source-level context | Produces stakeholder-facing outputs |
For export-facing manufacturers, the same principle is becoming relevant beyond Indian disclosures.
The EU Carbon Border Adjustment Mechanism entered its definitive regime on 1 January 2026. It applies to selected goods in cement, iron and steel, aluminium, fertilisers, electricity and hydrogen. Manufacturers participating in affected supply chains may consequently receive requests for installation-level emissions information and supporting operational data. Refer to the European Commission’s CBAM overview.
This does not mean that every Indian factory is covered by CBAM.
It demonstrates a broader direction: important environmental figures are increasingly expected to be traceable to the activities and records from which they were derived.
EHSSaral is a factory-side environmental compliance and data-intelligence platform for Indian industries.
It is not intended to replace ESG or carbon-accounting platforms. Its role is to organise and strengthen the environmental records beneath them.
EHSSaral currently focuses on:
The platform’s broader direction includes deeper hazardous-waste lifecycle management, consent-linked workflows and structured data exchange with ESG and carbon-accounting systems.
This can include connecting:
For example, EHSSaral can help organise the records used to establish an approved hazardous-waste quantity and preserve its supporting trail. An ESG platform can then map that reviewed information to the appropriate sustainability disclosure or enterprise dashboard.
The division of responsibility is straightforward:
ESG platforms calculate, consolidate and disclose. EHSSaral helps structure, reconcile and trace the environmental information generated inside factories.
ESG platforms and sustainability consultancies do not need to rebuild every plant-level environmental compliance workflow.
They can work with systems that understand how environmental data is generated and maintained inside Indian factories-from consent requirements and ETP records to hazardous-waste manifests and disposal evidence.
This can reduce the time consultants spend:
It also allows ESG platforms to focus on their strongest capabilities: calculations, reporting frameworks, analysis and enterprise-level disclosures.
For factories, the benefit is equally important.
Environmental data can be captured at its source, reviewed properly and then used for several legitimate reporting purposes without losing its operational context.
The objective is not to introduce another disconnected application. It is to create a dependable flow between factory operations, compliance requirements and sustainability reporting.
A partnership does not need to begin with a company-wide implementation.
A useful pilot could start with:
Hazardous waste, water or Form V information can provide a practical starting point.
The pilot can evaluate:
This creates evidence for a larger partnership without requiring either party to redesign its full platform.
India does not lack ESG calculators, carbon-accounting systems or corporate sustainability dashboards.
The larger unresolved issue is the journey before environmental data reaches those tools.
A water figure begins with meters, bills and operating records.
A waste figure begins with generation, storage, movement and disposal.
A carbon figure begins with electricity, fuel, production and process information.
If those source records remain fragmented, the final ESG dashboard may appear complete while uncertainty remains underneath it.
The strongest ESG systems will therefore be supported by a dependable factory-side data foundation-one that preserves definitions, evidence, relationships, reviews and operational context.
EHSSaral is building this connection for Indian environmental workflows and is open to exploring pilot data partnerships with ESG platforms, sustainability consultancies and enterprise teams.
A practical starting point can be one client, one factory and one dataset. The purpose is to understand how much stronger the final ESG output becomes when its plant-level environmental information is structured before it reaches the calculator.
Because better ESG reporting does not begin with the final disclosure.
It begins with how environmental data is generated, understood and maintained inside the factory.
ESG data management is the process of collecting, classifying, reviewing, approving and preserving the operational information used in sustainability reporting. At factory level, this may include electricity, fuel, water, effluent, emissions, waste and production data.
The information is usually distributed across EHS, finance, maintenance, production, purchase, security and outside vendors. It may also exist in different formats, units and reporting periods.
It can collect final values and supporting documents. However, it may not manage every underlying compliance record, departmental workflow, quantity reconciliation or vendor follow-up required to establish those values.
No. ERP systems can provide valuable purchase, production and invoice data, but they may not understand environmental classifications, consent conditions, waste manifests, regulatory returns or evidence requirements.
IoT meters can improve the frequency and consistency of readings. The data still needs classification, instrument checks, reporting boundaries, exception handling, review and evidence linkage.
Not necessarily. The reporting period, organisational boundary, classification or calculation method may differ. However, the difference should be documented and explainable from a consistent set of source records.
Environmental data provenance is the ability to explain where a reported figure originated, how it was calculated or classified, which evidence supports it and who reviewed or approved it.
Hazardous-waste disclosures may depend on Form 3 records, Form 10 manifests, opening and closing stock, weighbridge slips, acknowledgements and recycling or disposal evidence. These records help establish the final quantities reported to ESG systems.
No. The correct frequency depends on the parameter and its use. Meter readings may be daily, bills monthly, waste movements event-based and regulatory returns annual. Timely and traceable data is more important than making every record real time.
EHSSaral focuses on the factory-side environmental compliance and data layer. It helps organise, reconcile and trace plant-level information before approved data is used by ESG, carbon-accounting or corporate reporting systems.
Yes. A practical partnership can begin with one client, one manufacturing site and one environmental dataset. This allows both parties to test the factory-to-ESG workflow before considering a larger rollout.
Where SPCB portals do not offer open APIs for integration, EHSSaral prepares reviewed information up to the preview and copy-paste stage. The authorised user remains responsible for reviewing and submitting the final return.

Founder, EHSSaral
Founder - EHSSaral | Partner - Perfect Pollucon | ISO 14001 Lead Auditor | GHG Protocol Scope 2 | Chemist | Data Scientist | Second-generation environmental professional simplifying EHS compliance for Indian industries through practical, automated, tech-enabled, data driven compliance workflows.
Environmental Calendar from Consent Conditions (Practical Guide) | EHSShala

New Labour Codes in India Effective Nov25: Mandatory Appointment Letters & Health Checks | EHSSaral
 by EHSSaral v1.webp)
EADA Portal & Environment Audit Rules 2025: A Practical Guide for Indian Factories | EHSSaral

The Paper Shield: PF & ESIC Challans vs Real Compliance Risk | EHSSaral
 EHSSaral v1.png)
Blue Category MPCB 3-Year Consent Validity for Recyclers (2026) | EHSSaral

Bio-Medical Waste Management for Non-Hospitals (India) | EHSShala

Ultimate MPCB Form IV Checklist for Maharashtra Industries

Why Safety Culture Fails in Indian SMEs: People & Compliance Challenges | EHSSaral Research
Used Oil & Waste Oil Management in India - Factory & EHS Guide | EHSShala
Noise Monitoring in Factories Workplace vs Boundary (India Guide) | EHSShala