 EHSSaral.webp)
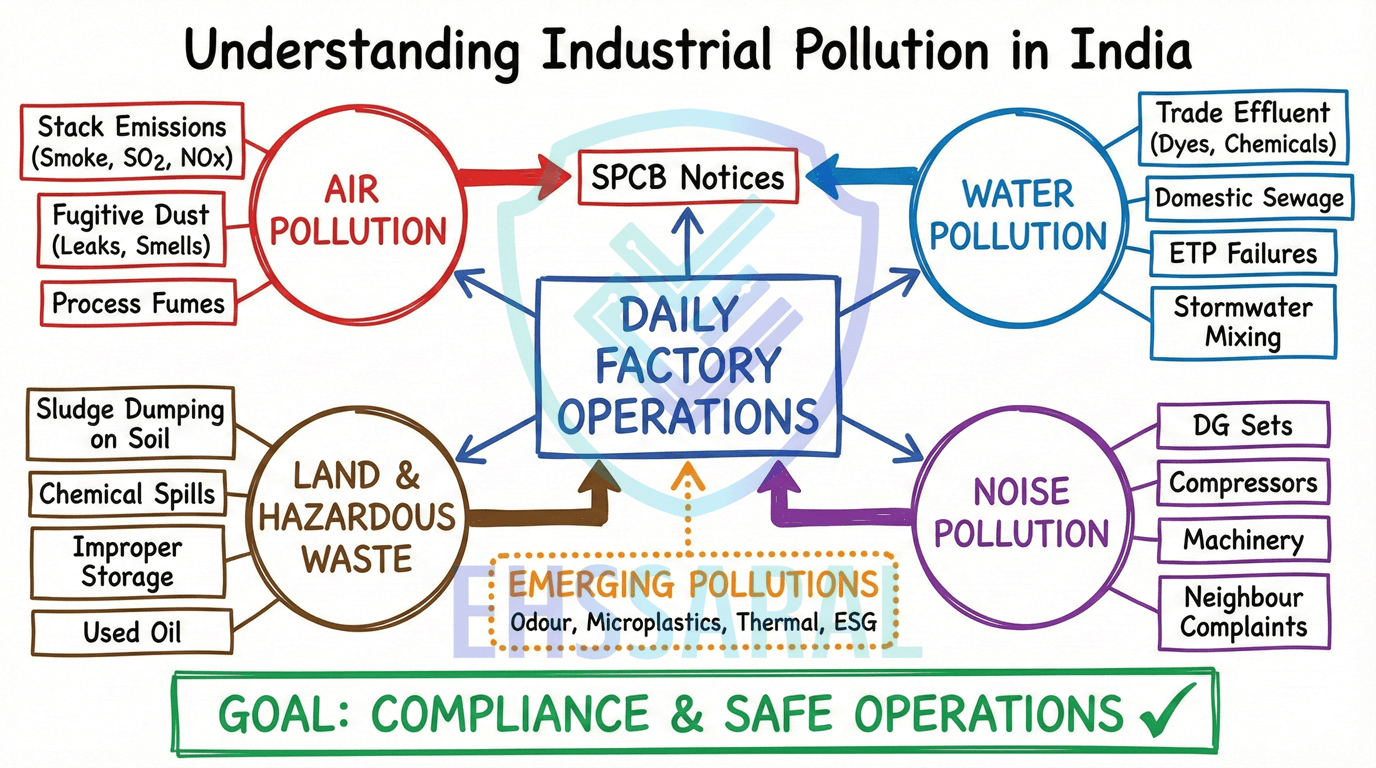
Environmental Monitoring Mistakes in Indian Factories (Real Issues Explained)
Environmental Monitoring SPCB Compliance Stack Monitoring Effluent Monitoring OCEMS EHS India Factory Compliance
Last updated:
|27 Apr 2026
Read time: 13 min read
What Actually Goes Wrong, Why It Happens, and How to Fix It
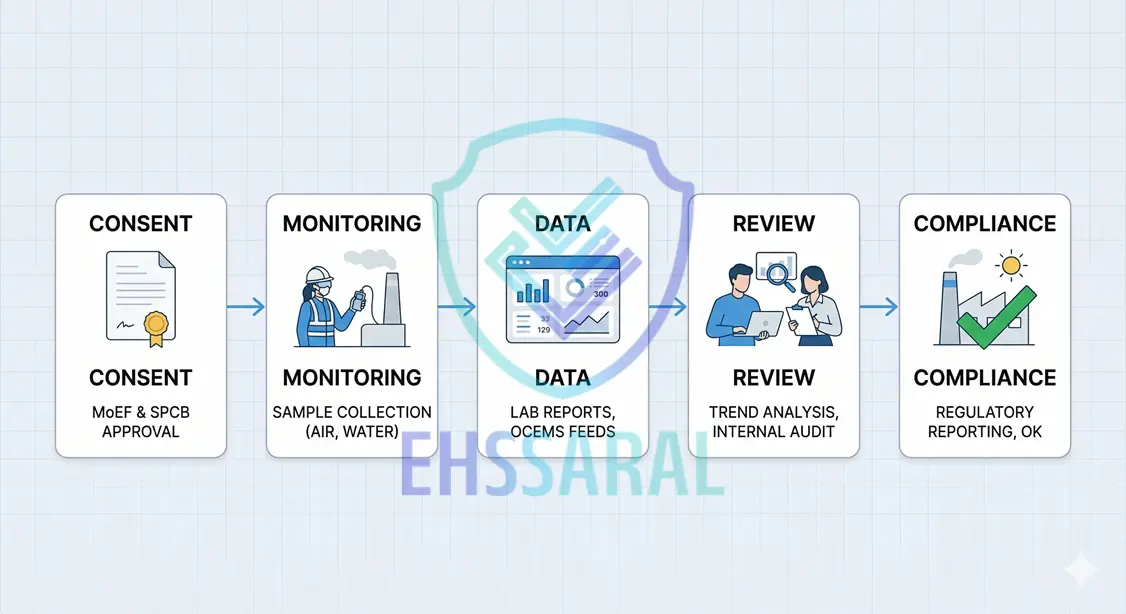
Why This Topic Matters More Than It Looks
A very common situation in factories goes like this.
Monitoring is completed.
Report comes from the lab.
Values are within limits.
Everyone relaxes.
Files are kept properly.
Compliance looks “under control.”
Then suddenly - a query comes.
Sometimes during inspection.
Sometimes during consent renewal.
Sometimes because of OCEMS data.
And the same question comes from management:
“Report toh within limit hai… phir problem kya hai?”
This is where most confusion starts.
Because in environmental monitoring, there are two different realities:
Monitoring done
Monitoring understood
And most factories operate only in the first.
Ground reality:
“Most problems don’t start when limits are crossed.
They start when data stops making sense.”
The Hidden Nature of Monitoring Mistakes
Monitoring mistakes are not like equipment breakdowns.
They don’t make noise.
They don’t stop production.
They don’t show immediate impact.
That is why they stay hidden for long time.
Why Mistakes Stay Invisible
Reports come on time
Values are within limits
No complaints from outside
From outside, everything looks fine.
Even internally, nobody feels there is an issue.
This creates a false sense of confidence.
When They Suddenly Surface
These same mistakes come out only in certain situations:
During inspection
During consent renewal
When OCEMS data does not match
When audit becomes more detailed
At that point, questions start coming.
And answers are not ready.
We have covered inspection expectations in detail in our environmental inspection guide
Why This Creates Panic
This is where most EHS officers feel pressure.
Data is there, but explanation is missing
Team starts blaming lab or consultant
Old reports cannot be justified
This is not because someone did something wrong.
It is usually because:
“System was not built to understand the data.”
10 Common Monitoring Mistakes Seen in Indian Factories
These are not rare cases.
These are patterns seen again and again across different industries.
1. Confusion Between Grab and Composite Sampling
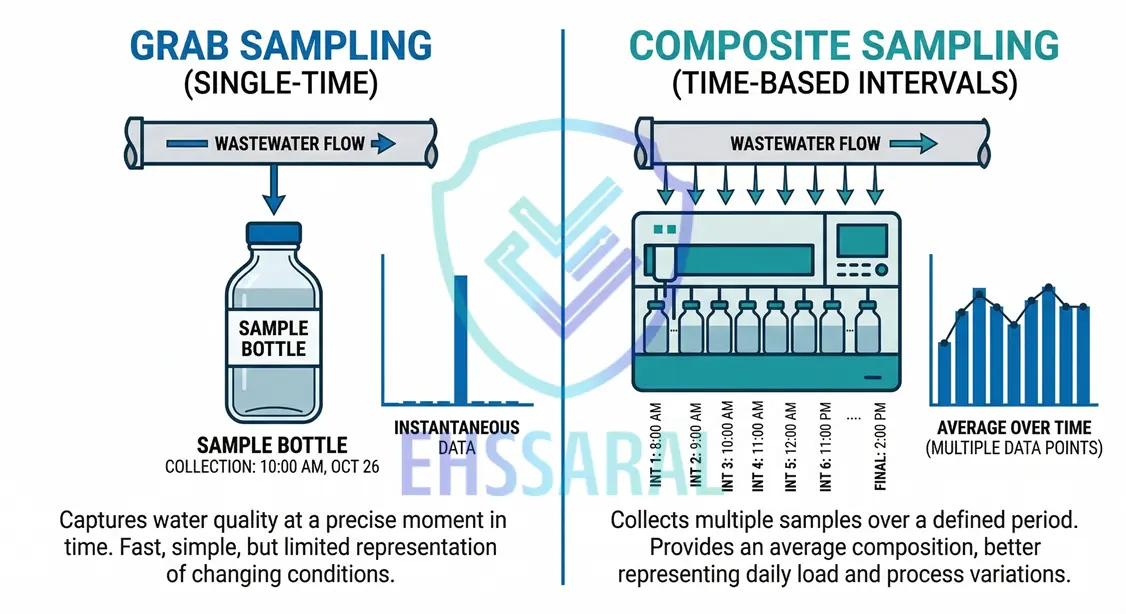
This is one of the most common mistakes.
Many times, effluent samples are taken as grab samples
while consent requires composite sampling.
On paper, both look like “samples.”
But practically, they are very different.
Grab sample = one-time snapshot
Composite sample = average over time
When wrong method is used:
Data does not represent actual discharge
Trends become misleading
Questions arise during audit
In many cases, this mistake continues for months
because nobody checks the method, only the result.
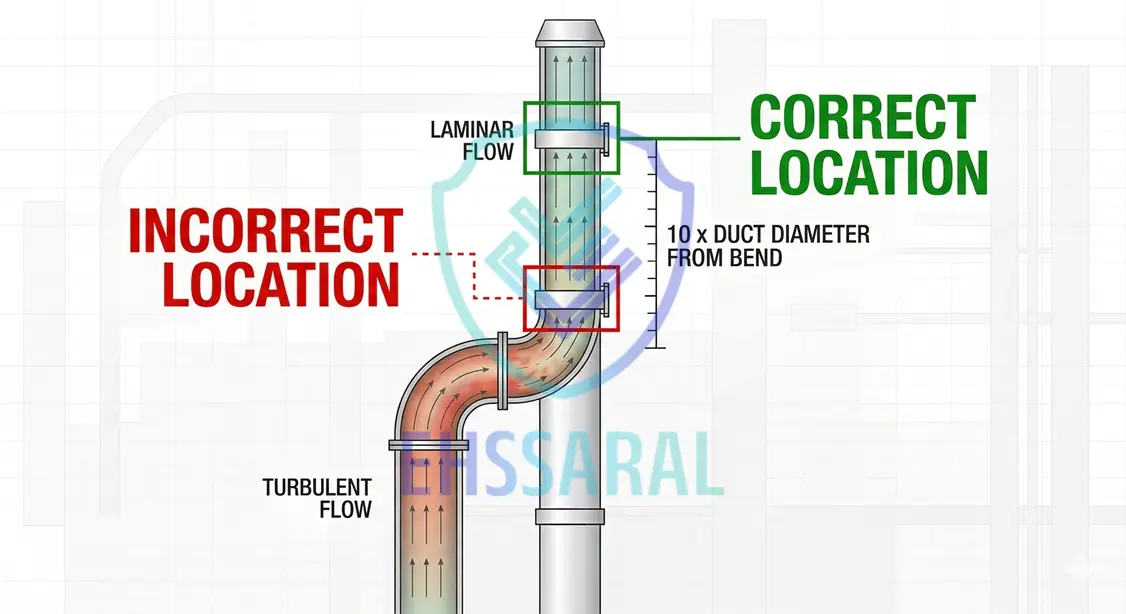
2. Sampling from Convenient Locations Instead of Correct Points
This happens very often.
Sample is taken from:
Easy access point
Before treatment
Somewhere inside plant
Instead of actual discharge point.
Reason is simple:
“Wahan se sample lena easy hai.”
But during inspection, first question is:
“Yeh final discharge point hai?”
If answer is not clear, whole monitoring becomes questionable.
3. No Supporting Data (Flow, Production, Logs)
Monitoring data alone is not enough.
It must connect with:
Production data
Water consumption
Flow measurements
But in many factories:
Monitoring report exists
But no supporting records
So when question comes:
“Yeh value kaise aaya?”
There is no answer.
Data looks isolated.
4. Blind Trust in Lab Reports
This is very common.
Lab comes → sampling done → report submitted → file closed.
No internal review.
No questions asked.
In many cases:
Plant team is not present during sampling
Location not verified
Conditions not noted
Lab does their job.
But responsibility of correctness still stays with factory.
5. OCEMS Installed but Not Actively Monitored
OCEMS is installed in many plants now.
But ground reality:
System runs
Data goes somewhere
Nobody checks daily
Only when query comes, dashboard is opened.
By that time:
Gaps already exist
Trends already inconsistent
OCEMS is treated like equipment, not like a monitoring tool.
This gap is explained in detail in our guide on manual vs OCEMS monitoring
6. Ignoring Process Variations
Plants do not operate the same every day.
Load changes
Raw material changes
Shutdowns happen
But monitoring is usually done:
On stable days
Under controlled conditions
So reports always look “good.”
But they do not represent actual plant behaviour.
7. Same Values Repeating Every Month
This is a silent red flag.
PM always same
BOD always same
Noise almost identical
It may look like good control.
But practically:
“No process is that stable.”
Repeated values raise questions during inspection.
8. Calibration and Maintenance Ignored
Monitoring equipment needs regular attention.
But often:
Calibration is delayed
Instruments drift
Sensors give incorrect readings
And still data is trusted.
This is not visible immediately.
But over time, accuracy is lost.
9. Monitoring Done Only Near Due Dates
Monitoring becomes a “deadline activity.”
Date comes → lab called
Sampling done → report submitted
No tracking in between.
No understanding of trends.
So compliance exists only on paper.
10. Noise Monitoring Done Incorrectly
Noise monitoring is often neglected.
Common issues:
Measured inside boundary instead of at boundary
Only daytime monitoring done
Night data missing
Because noise is not seen as “critical,”
it gets less attention.
But during audit, it is still checked.
11. Chain of Custody Not Maintained
This is a simple but serious gap.
Sample collected
But no proper record of:
Date
Time
Person
Handling
If traceability is missing:
Data becomes difficult to defend
Lab results can be questioned
Ground reality:
“Most mistakes are not technical failures.
They are small gaps that were never checked.”
What Inspectors Actually Look For (And How Mistakes Get Caught)
When an inspector visits, they don’t start by assuming you are wrong.
They start by trying to understand your system.
But if things don’t connect… questions start.
1. Does Data Match Plant Reality?
This is usually the first check.
Inspector will try to connect:
Emissions vs fuel usage
Effluent vs water consumption
Production vs pollution load
If your plant is running high production
but emissions look unusually low,
it raises a question.
Not because values are high or low.
But because:
“Do these numbers logically match?”
2. Are Sampling Locations Correct?
This is one of the most common gaps.
Inspector may physically check:
Stack sampling port
Effluent discharge point
Ambient air monitoring location
Noise monitoring boundary
And then compare with your report.
Typical questions:
“Yeh sampling yahin se liya tha?”
“Final discharge point kaunsa hai?”
If location is unclear or incorrect,
then even a good report loses value.
3. Do Calculations Make Sense?
Inspectors don’t always need complex formulas.
Simple logic is enough.
They may check:
Flow vs sample volume
Sampling duration vs actual timing
Velocity vs stack size
If numbers don’t align,
it indicates:
“Data may not be reliable.”
4. Are Trends Logical?
One report is rarely the issue.
Trend is what matters.
Inspector may look at:
Last 6 months data
Repeated values
Sudden drop or improvement
If values are:
Too consistent
Too perfect
Suddenly improved
it raises doubt.
Because real systems fluctuate.
5. Is There Supporting Evidence?
This is where many factories struggle.
Inspector may ask for:
Logbooks
Flow records
Calibration certificates
Sampling photos
If reports exist
but supporting records don’t,
then explanation becomes weak.
Ground reality:
“Inspectors don’t just check reports.
They check whether your system makes sense.”
Real Patterns Seen Across Factories
These are not isolated incidents.
These are patterns seen again and again across different plants.
Stack Monitoring Patterns
Sampling done from incorrect port
Velocity calculations not matching actual conditions
Emission values not aligning with fuel consumption
Sometimes reports look fine.
But when connected with plant data,
they don’t add up.
Effluent Monitoring Patterns
Sample not taken from final discharge
No linkage with flow data
Stable values despite process variation
In many cases:
Effluent data looks “perfect”
but system behind it is unclear.
Ambient Air Monitoring Patterns
Monitoring location not in downwind direction
Short duration sampling instead of required duration
This leads to:
Under-representation of actual conditions
Questions during inspection
Noise Monitoring Patterns
Measurement taken inside plant boundary
No night monitoring data
Because of this:
Actual exposure is not captured
Compliance becomes questionable
Hazardous Waste Patterns
Waste classified without proper testing
Samples not representative of actual waste
This creates confusion later:
During disposal
During audit
During documentation checks
Important line:
“Most issues are not violations.
They are validation problems.”
Red Flags That You Are Heading Towards a Monitoring Problem
Before a problem becomes visible,
there are always signals.
Most of the time, they are ignored.
Check these honestly.
You cannot clearly explain last month’s values
Same numbers are repeating every month
OCEMS dashboard is not checked regularly
Lab submits reports without asking any questions
Sampling locations are not documented properly
Data does not match across reports and plant records
Monitoring happens only near due dates
If you relate to 2–3 of these, it is manageable.
If you relate to most of them:
System needs attention.
Why These Mistakes Actually Happen (Ground Reality)
These problems are not because people don’t care.
They happen because systems are not designed properly.
Knowledge Gaps
Consent conditions not fully understood
Technical terms not clear to field team
Many times:
People follow process
without fully understanding purpose.
Understanding consent conditions properly is the first step in avoiding monitoring mistakes.
System Gaps
No clear monitoring plan
No cross-check system
No internal review
Everything depends on:
Lab
Consultant
But no internal control exists.
Time Pressure
Monitoring done close to deadline
Sampling rushed
Reports submitted without review
This creates habit:
“Just complete and submit.”
Ownership Gaps
Responsibility unclear
Over-dependence on consultant
When something goes wrong:
Blame starts moving.
Communication Breakdowns
Field team and office team not aligned
New EHS officer not aware of past practices
Consultant changes, context lost
Information does not flow properly.
Ground reality:
“Most monitoring mistakes are not due to negligence.
They are due to missing systems.”
Simple Systems That Prevent 80% of Monitoring Problems
You don’t need complex software or heavy processes.
On most sites, a few basic practices can solve majority of issues.
1. Create a Consent-to-Monitoring Mapping Sheet
Start with one simple question:
“What exactly are we supposed to monitor?”
Take your consent document and extract:
Parameter (PM, SO₂, BOD, Noise, etc.)
Location (stack, discharge point, boundary, etc.)
Frequency (monthly, quarterly, etc.)
Method (grab / composite / duration)
Put this in one simple sheet.
This becomes your base.
Without this, monitoring becomes guesswork.
2. Maintain One Monitoring Tracker
Keep one central tracker.
It can be Excel. No need to overcomplicate.
Include:
Last monitoring date
Next due date
Status (done / pending)
Report received or not
This avoids:
Last-minute panic
Missed timelines
3. Link Monitoring Data with Plant Data
Monitoring data alone is not enough.
Start connecting:
Production vs emissions
Water consumption vs effluent
Fuel usage vs stack parameters
Even basic comparison gives clarity.
If numbers don’t align,
you catch it early - not during inspection.
4. Daily OCEMS Check (2–5 Minutes)
You don’t need deep analysis every day.
Just a quick look:
Is data coming?
Any gaps?
Any unusual spike?
This small habit prevents:
Long data gaps
Sensor issues going unnoticed
5. Pre-Submission Review Habit
Before filing any report, pause for 5 minutes.
Check:
Units
Unusual values
Comparison with previous data
Ask one question:
“Does this make sense?”
This one habit avoids many future questions.
6. Keep One Common Document Folder
Maintain one simple folder (digital or physical):
Monitoring reports
Calibration certificates
Logbooks
Supporting records
When everything is in one place:
Retrieval becomes easy
Confidence increases during inspection
7. Use a Simple Field Checklist
Before sampling:
Location confirmed
Equipment ready
Method clear
Time recorded
After sampling:
Logbook filled
Details recorded
This reduces dependency on memory.
Ground reality:
“Good monitoring does not need complex systems.
It needs simple systems used regularly.”
A Practical Weekly Monitoring Routine
Most people think monitoring needs a lot of time.
It doesn’t.
Even 10–15 minutes spread across the week is enough.
Monday – OCEMS Check (5 minutes)
What to do:
Check if data is flowing
Look for gaps or spikes
Why:
Early detection of issues
Mid-Week – Data Review (5–10 minutes)
What to do:
Compare recent data with previous values
Check if anything looks unusual
Why:
Catch inconsistencies before reports come
Before Monitoring Activity
What to do:
Review checklist
Confirm location and method
Why:
Avoid basic mistakes
After Receiving Report
What to do:
Quick review before filing
Compare with past data
Why:
Ensure data is explainable
This routine is simple.
But if followed regularly,
it builds strong control.
If Mistakes Have Already Happened (Damage Control)
This is a situation many people face.
And this is where most panic happens.
Let’s keep it simple.
Before Any Notice Comes
If you feel something is off:
Review your own data
Identify gaps
Note what needs correction
Start fixing internally.
Even small corrections help.
After Receiving a Query
First step: don’t panic.
Second step: don’t immediately blame lab or consultant.
Instead:
Understand the issue
Explain clearly
Show what you are correcting
Inspectors usually respond better to clarity
than to defensive replies.
Ground reality:
“Clear explanation works better than perfect excuses.”
What a Good Monitoring System Looks Like
You don’t need perfection.
But a good system has some clear signs:
Data matches plant operations
Team understands basic numbers
Reports are explainable
No last-minute panic
When this happens:
Inspections become smoother
Confidence improves
Work pressure reduces
Final Ground Reality
Monitoring is not about collecting data.
It is about understanding your plant.
Most factories don’t struggle because pollution is high.
They struggle because:
“They cannot explain their data when it matters.”
If you fix that one thing,
most monitoring problems automatically reduce.
FAQs
Q1: What is the most common environmental monitoring mistake?
Wrong sampling method or location. Data may look correct but not represent actual conditions.
Q2: How do SPCB inspectors detect monitoring errors?
By comparing monitoring data with plant operations like production, fuel use, and flow records.
Q3: Is a lab report enough for compliance?
No. Reports must match plant data and proper sampling practices.
Q4: How often should OCEMS data be checked?
A quick daily check (2–5 minutes) helps identify gaps and unusual trends early.

Harshal T Gajare
Founder, EHSSaral
ISO 14001 Lead Auditor | Second-generation environmental professional simplifying EHS compliance for Indian manufacturers through practical, tech-enabled guidance.
Related Blogs
 by EHSSaral v1.webp)
EADA Portal & Environment Audit Rules 2025: A Practical Guide for Indian Factories | EHSSaral

Managing Safety Without Authority: Handling Protected Contractors in Indian Plants | EHSSaral
E-Waste Management Rules (2022) in India - Practical Guide for Factories | EHSShala

Factories Act 1948: Download Compliance Checklist & Rules PDF | EHSSaral
Other Waste Streams in Indian Factories | Battery, E-Waste, Plastic & More | EHSShala
Form 4 Annual Return Explained (Hazardous Waste - India) | EHSShala
MSME Supply Chains & BRSR 2026: Where Compliance Breaks | EHSSaral
Beyond the Helmet: Why Safety Compliance Alone Fails in Indian Factories | EHSSaral Research