
Environmental Inspection India: What Inspectors Check | EHSSaral
Environmental Inspection SPCB Inspection Environmental Compliance India Factory Inspection EHS India Show Cause Notice Pollution Control Board
Last updated:
|13 Feb 2026
Read time: 12 min read
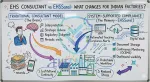
A Ground Reality Guide for EHS Officers and Plant Managers
Why This Article Exists
In many Indian factories, inspection stress does not come from non-compliance.
It comes from uncertainty.
You may know your Consent to Operate conditions.
You may have reports filed.
You may have an ETP, scrubber, or hazardous waste shed in place.
Yet when an inspection vehicle enters the gate, tension rises.
Why?
Because inspections are not only about documents.
They are about operational consistency.
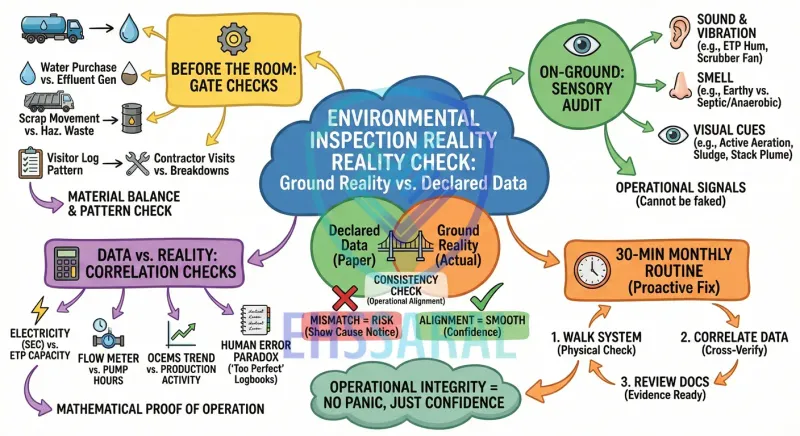
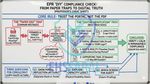
Environmental inspections in India are designed to verify one simple thing:
Does the ground reality match what has been declared in your consent, reports, and returns?
This article is not about avoiding inspection.
Quick Summary (For Busy Plant Heads)
Inspections are mainly about alignment between records and reality.
Observations often begin at the gate and material movement level.
The first checks are usually ETP/APC operational signals, not presentations.
Most notices start from data mismatch (energy, flow, OCEMS, logbooks).
A simple 30-minute monthly routine prevents inspection panic.
It is about understanding how inspections are conducted in practice - so that your systems demonstrate integrity naturally.
The Inspection Mindset: Pattern Recognition, Not Paper Review
Inspection teams across states - whether from SPCBs, CPCB task forces, or joint committees - have visited hundreds of plants.
Over time, they develop pattern recognition.
They notice:
What a continuously running ETP looks like
What properly stored hazardous waste feels like
What “real” daily logbooks look like
What operational inconsistency smells like
They are not looking for perfection.
They are looking for alignment.
When alignment exists, inspections move smoothly.
When there are gaps between data and ground conditions, questions begin.
ETP & STP Troubleshooting The Ultimate Guide
One Practical Rule: Always Anchor to Your Consent Conditions
In day-to-day operations, many teams prepare for inspections by gathering reports.
But inspection questions often start from a simpler place:
“What did you commit in your Consent to Operate, and is it visible on site?”
Inspectors commonly cross-check on-ground observations against specific consent conditions such as:
Approved production capacity and product list
ETP/air pollution control system configuration mentioned in consent
Stack height and APC equipment requirements
Outlet/discharge points and permitted parameters
Monitoring frequency commitments (stack, effluent, noise, etc.)
Hazardous waste storage and disposal conditions
Practical habit: keep your latest consent easily accessible (printed or bookmarked), with key operational conditions marked.
It changes the inspection conversation from confusion to clarity.
SPCB Consent Guide: CTE, CTO, Renewal, Fees & Conditions by EHSShala Team
Before the Conference Room: What Happens at the Gate
In theory, inspections begin with introductions.
In practice, observations often begin before that.
1. Security Register Cross-Checks
Inspection teams frequently glance at the gate records.
Why?
Because gate entries reflect operational activity.
Common correlations include:
Water tanker entries vs declared water consumption
Scrap vehicle movement vs hazardous waste disposal records
Chemical inward entries vs reported production levels
Visitor log patterns vs third-party contractor presence
Contractor/maintenance visitor patterns (frequent mechanical/electrical visits often indicate breakdown periods - useful to reconcile with plant logs)
Regular visits by scrap buyers or transporters vs disposal/manifests (a simple “movement vs paperwork” consistency check)
Example:
If your plant declares minimal effluent generation but water tanker purchases are consistently high, that raises a basic operational question:
Where is the water going?
This is not suspicion.
It is simple material balance logic.
Checklist for SPCB & CPCB Environmental Inspection
The First 15 Minutes: Why Inspectors Visit the ETP or APC System Early
Many EHS managers prepare presentations.
However, inspection teams often prefer to observe systems first.
2. Is the Pollution Control System Actually Operating?
An operational plant leaves visible and audible signals.
For Effluent Treatment Plants (ETPs), teams may observe:
Aerator noise consistency
Pump vibration patterns
Sludge recirculation movement
Chemical dosing tanks (are they active?)
Online pH meter readings
Clarifier surface condition
A continuously running biological system has signs of life:
Slight earthy odour
Active aeration
Visible biomass
An idle or recently restarted system may show:
Flat surface water
No foam formation
Anaerobic odour (rotten egg smell)
Settled sludge without circulation
These are not “tests.”
They are observational cues.
Environmental control systems that operate daily develop predictable characteristics.
Consistency builds confidence.
The Sensory Audit: What Cannot Be Hidden by Paper
Environmental systems are physical systems.
They consume power, chemicals, maintenance effort - and they leave consistent operational signals.
This is why inspection teams often connect what they see/hear/smell with a simple compliance question:
ETP looks inactive → “Are you treating daily, or only when required?”
ETP smells septic/anaerobic → “Is the biological system stable, or has it been off?”
Scrubber fan sounds strained / heavy vibration → “Is pressure drop high due to choking, poor maintenance, or wrong operation?”
Visible plume during low declared production → “Is process load aligned with what is being recorded?”
DG acoustic enclosure not shut properly → “Is noise control treated as routine or as a report-only requirement?”
These are not accusations.
They are operational consistency checks.
When you understand this, you stop trying to “prepare documents” and start building a system that looks stable on any normal day.
EADA Portal & Environment Audit Rules
Data vs Ground Reality: Where Most Show-Cause Notices Begin
This is the most common trigger area.
Not missing paperwork.
Not formatting errors.
But mismatch between declared data and operational reality.
Let us break down common correlation checks.
3. Electricity Consumption vs ETP Capacity
(Specific Energy Consumption – SEC)
Inspection teams sometimes calculate Specific Energy Consumption (SEC).
SEC = Total electricity used by ETP ÷ Volume of effluent treated
Example (simplified):
ETP capacity: 50 KLD
Reported average treatment: 40 m³/day
Industry-typical SEC range: 0.8–1.2 kWh per m³
Expected daily energy use:
40 × 1.0 ≈ 40 kWh/day (approximate benchmark)
If electricity bills indicate only 5–8 kWh/day attributed to the ETP, this signals a correlation gap.
It does not automatically imply violation.
But it requires explanation.
Environmental treatment systems consume predictable energy.
Extremely low consumption relative to declared treatment volume raises questions.
4. Flow Meter Readings vs Pump Hours
If discharge flow meters show continuous 24-hour operation, but pump hour meters indicate limited runtime, that mismatch becomes visible.
Similarly:
Magnetic flow meters must be physically connected
Hour meters should show progressive increase
Data logs should show natural variability
Uniform, identical readings across multiple days appear unrealistic.
Operational systems rarely produce identical numbers every day.
A simple best practice is to ensure records show natural day-to-day variability, because real operations are rarely identical across weeks.
5. OCEMS Data vs Production Activity
For industries with Online Continuous Emission Monitoring Systems (OCEMS):
Stack emissions data trends are compared with production logs
Shutdown days should show lower emission trends
High production days should show proportional changes
Flat-line data patterns during active production may trigger deeper technical checks.
Again, this is correlation logic.
Not accusation.
If there is a genuine sensor, calibration, or connectivity issue, keeping a clear maintenance trail and communication record reduces confusion during inspection.
6. The Human Error Paradox: “Too Perfect” Logbooks
Real operations are human.
Logbooks usually contain:
Minor overwriting
Different pen pressure
Slight handwriting variation
Occasional corrections
When a month of entries appears written in identical ink, identical handwriting, and perfectly spaced formatting, it may raise a simple observation:
Was this filled daily, or in bulk?
Bulk entry creates a credibility gap.
Natural documentation looks human.
Perfection sometimes appears artificial.
Consistency is stronger than cosmetic neatness.
Hazardous Waste: The 90-Day Storage Reality
Under Indian rules, hazardous waste generally should not be stored beyond the permitted duration (commonly 90 days, unless extended).
Inspection teams typically verify:
Drum labeling dates
FIFO (First-In-First-Out) practice
Physical inventory vs manifest records
Spillage containment trays
Common gap:
Older drums pushed to the back of the shed.
Inspectors often check rear rows first.
If labels indicate significantly older dates, it can trigger a notice.
This is usually not deliberate.
It is often inventory management oversight.
Simple monthly rotation avoids this issue entirely.
Common Innocent Mistakes That Look Like Violations
Many show-cause notices arise from small, manageable gaps.
Examples include:
Flow meter calibration expired by a few weeks
Calibration certificate available but not filed properly
Drum label faded due to weather
ETP operator on leave and no alternate signatory
Noise monitoring report completed but not printed
Sludge analysis report pending from laboratory
These are not environmental disasters.
But during inspection, documentation gaps become compliance questions.
Operational integrity requires not only system functioning - but evidence availability.
Top Reasons Units Receive Environmental Show-Cause Notices
| Trigger | Why It Happens | Severity | Fix Evidence |
|---|---|---|---|
| ETP not operational at visit | Intermittent running | High | Daily runtime log + Energy bill correlation |
| SEC extremely low | Underutilization or bypass suspicion | Medium to High | Documented SEC calculation (kWh/m³) + justification for variance (technology/partial load/shutdown days) + dated internal review note |
| Flow meter calibration expired | Overlooked renewal | Medium | Calibration certificate + dated technician visit photo |
| Hazardous waste stored beyond limit | Inventory tracking gap | High | Disposal manifest + FIFO register |
| OCEMS data flat-line | Sensor or data transmission issue | Medium | Maintenance log + communication check record |
| Incomplete logbooks | Bulk entry or oversight | Medium | Revised daily recording protocol |
Severity depends on context.
Repeated mismatch increases risk.
Single isolated gaps, when explained transparently, are often resolved through corrective action.
The 30-Minute Monthly Inspection Readiness Routine
Instead of waiting for inspection notice, adopt a simple internal practice.
Once a month:
Step 1: Walk the System (10 Minutes)
Visit ETP/APC system physically
Check sound, vibration, flow
Review sludge condition
Verify hazardous waste label security Register Cross-Check
Step 2: Correlate Data (10 Minutes)
Compare electricity consumption vs treatment volume
Check pump hour meters
Review OCEMS trend pattern
Confirm flow meter functionality
Step 3: Review Documentation (10 Minutes)
Calibration certificates valid?
Waste manifests updated?
Logbooks filled daily?
Operator signatures consistent?
This routine prevents panic.
Inspections should confirm what you already know - not reveal surprises.
Close the loop with evidence: capture 3–5 dated photos (ETP running, HW shed labels, meter readings) or write a short dated note of the walk-through.
If an inspection occurs later, this becomes simple proof that compliance was being monitored proactively - not “prepared overnight.”
A Final Perspective
Environmental inspections are not adversarial events.
They are verification exercises - meant to confirm that what is declared in consent conditions and records is visible in day-to-day operation.
When your systems:
run consistently
consume predictable resources
produce realistic data
and maintain accessible evidence
…inspections usually become straightforward.
Most notices do not originate from one inspection day.
They originate from months of small correlation gaps that went unnoticed.
Clarity reduces fear.
Consistency reduces questions.
And operational integrity becomes visible on any normal working day - even before the first file is opened.
Frequently Asked Questions (Environmental Inspections in India)
1. What do environmental inspectors check first during factory visits?
Inspection teams often begin with gate registers and pollution control systems like ETPs before reviewing documents.
2. Can inspectors check electricity consumption of ETP systems?
Yes. Electricity consumption is sometimes correlated with treatment capacity to assess operational consistency.
3. What is the most common reason for environmental show-cause notices?
Mismatch between declared data and on-ground reality, especially related to hazardous waste storage and system operation.
4. Do inspectors compare consent conditions during inspection?
Yes. On-ground observations are often cross-checked against specific Consent to Operate conditions.
5. How can factories prepare for environmental inspections?
A simple monthly internal walk-through and data correlation review reduces inspection stress significantly.
6. Is environmental inspection only about paperwork?
No. Inspectors verify operational consistency, system functionality, and documentation alignment.

Harshal T Gajare
Founder, EHSSaral
Founder - EHSSaral| Partner - Perfect Pollucon | ISO 14001 Lead Auditor | Second-generation environmental professional simplifying EHS compliance for Indian manufacturers through practical, tech-enabled guidance.
Related Blogs

GRAP Stage IV Explained: What AQI 450+ Means for NCR Factories | EHSSaral
Factory Act & Compliance Thresholds: What Applies to Your Headcount? | EHSSaral
Why Most Environmental Non-Compliance Is a System Failure, Not Intent | EHSSaral
Why Safety Culture Fails in Indian SMEs: People & Compliance Challenges | EHSSaral Research
Environmental Compliance Management in India: Systems vs Consultants Explained

Why Good People Still Struggle With Compliance in Indian SMEs | EHSSaral Research

EHSShala Foundations - Core Environmental Basics for EHS Officers
How EHS Managers Can Verify EPR Credits Before Audit (DIY Guide) | EHSSaral