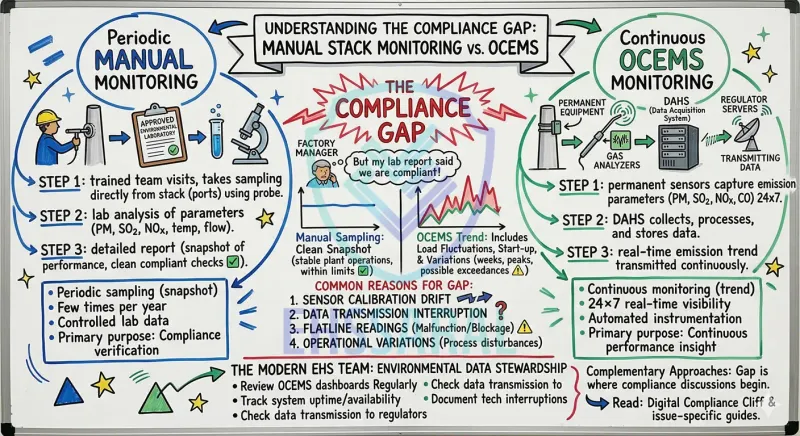
Common Reasons Manual Reports and OCEMS Data May Differ
In day-to-day plant operations, several practical situations can create visible differences between manual monitoring reports and OCEMS readings. In many cases, the issue is not actual pollution. It is the difference between how the two systems observe, record, and transmit information.
1. Scenario: The analyzer that slowly drifted
A plant’s last manual stack monitoring report shows particulate matter comfortably within the applicable limit. Over the following weeks, however, the OCEMS trend slowly starts moving upward.
Nothing dramatic happens in one day, so the change is easy to miss internally.
Later, when the data is reviewed, the team discovers that analyzer calibration checks were delayed and the sensor had gradually drifted away from its correct range.
This is one of the most common reasons manual reports and OCEMS values may not align neatly. The laboratory instrument was calibrated and verified for the day of testing. The OCEMS analyzer was operating continuously in a much harsher environment and had slowly moved.
Regular calibration review is therefore not just a technical activity. It is part of maintaining a reliable compliance record.
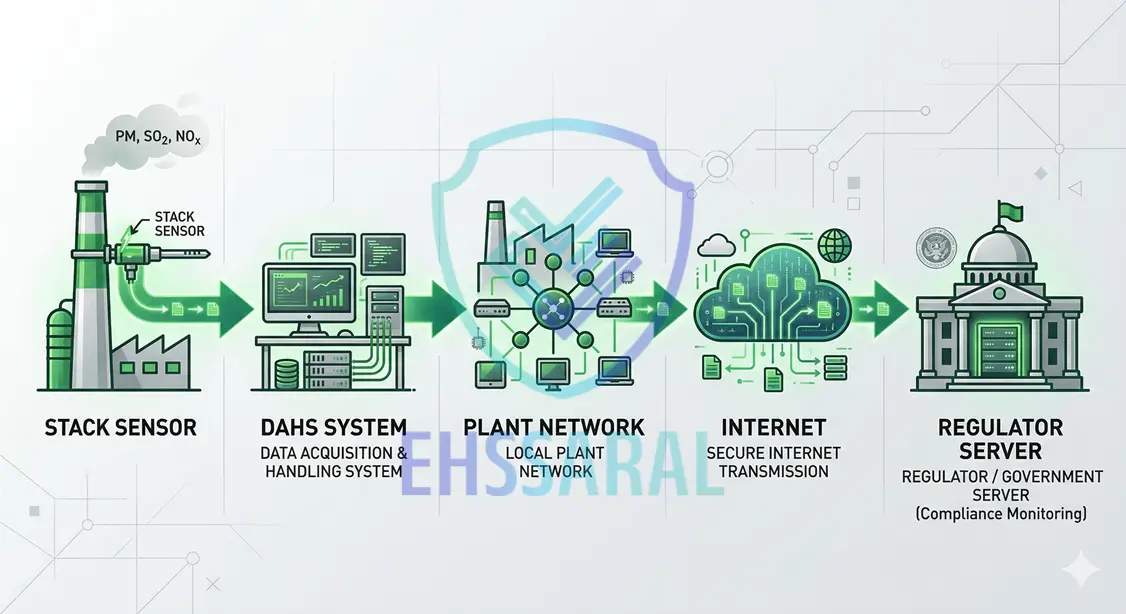
2. Scenario: The data reached your DAHS, but not the regulator
In some plants, local teams can still see readings in the DAHS and assume everything is fine.
Later, a regulatory query appears because the same period shows missing data on the server-side record visible to the authority.
This usually happens when one part of the transmission chain is interrupted:
Stack sensor → DAHS → Plant network → Internet connection → Regulator server
Even when plant emissions remain within limits, gaps in the regulatory server logs can trigger compliance queries because regulators can only evaluate the record that actually reached their system.
If you are already seeing missing readings or server-side gaps, refer to our practical guide: OCEMS Data Gap CPCB Rejection Guide.
3. Scenario: The flatline that looked suspicious
Another situation occasionally seen in continuous monitoring systems is a flatline pattern.
A flatline occurs when the recorded value remains unchanged for an extended period without the natural fluctuation normally expected in stack emissions.
Several technical reasons may cause this:
Sensor malfunction
Sampling line blockage
DAHS software freeze
Communication buffering issues
Even when the plant is operating normally, such a signal can appear unusual from a monitoring perspective. Real emission systems almost always show at least some movement over time.
That is why flatlines often attract attention even before the actual technical cause is confirmed.
If you have received a flatline observation or notice, this guide explains how teams typically respond: CPCB OCEMS Flatline Notice Response Guide.
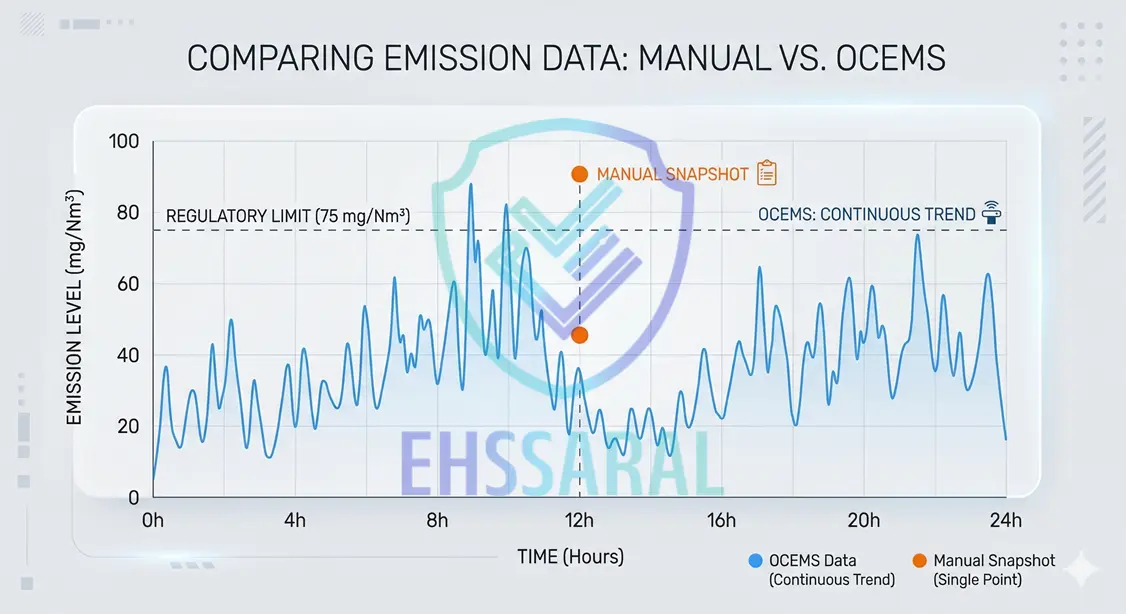
4. Scenario: The manual test was clean, but the operating cycle told a different story
Industrial processes rarely operate under identical conditions throughout the day.
A manual stack test is usually conducted during a defined sampling window, often when the plant is operating steadily. OCEMS, however, records behaviour across all operating phases.
That may include:
Start-up conditions
Load fluctuations
Temporary process disturbances
Variations in fuel quality
Operational adjustments in pollution control equipment
Because of this, OCEMS may capture temporary variations that do not appear in the manual monitoring report.
This does not automatically mean the manual test was wrong. It means the two systems were observing the plant from different time perspectives.
Why Continuous Monitoring Is Becoming More Important
Periodic monitoring remains an important compliance tool, but it only shows what happened during the sampling period.
Continuous monitoring became important because regulators increasingly needed visibility beyond isolated snapshots. A plant may perform well during a scheduled monitoring window and still show data patterns, operating fluctuations, or monitoring system issues across the rest of the operating cycle.
From a practical standpoint, continuous monitoring helps authorities and industries observe:
unexpected emission spikes
long-term performance drift in pollution control systems
unusual data patterns that require investigation
whether the monitoring system itself is functioning reliably
This is the bigger shift.
Environmental compliance is no longer viewed only through periodic laboratory reports. It is also viewed through the continuity, quality, and behaviour of digital monitoring records.
That is why OCEMS should not be treated as just another instrument on the stack. Once installed under consent conditions or regulatory direction, it becomes part of the plant’s compliance system.
Which Industries Are Typically Required to Install OCEMS
A common question from management is simple: “Does OCEMS apply to our plant?”
In India, OCEMS applicability usually comes from one of three places:
CPCB sector-wise directions / guidelines (for specific high-pollution sectors)
State PCB consent conditions (CTO/CTE conditions that explicitly mandate OCEMS)
Environmental Clearance conditions (for certain projects and expansions)
From day-to-day practice, OCEMS is most commonly seen in higher pollution-potential sectors and large capacity units.
Examples that are frequently covered (depending on sector size and consent conditions) include:
Thermal power and large boilers
Cement, metals, and mineral processing
Refineries, petrochemicals, and large chemical manufacturing
Certain large-scale pharma and bulk drug units
Pulp and paper
Distilleries and fermentation-based units
Waste incineration and co-processing setups
The practical way to confirm applicability is straightforward:
Check your Consent to Operate conditions for “OCEMS / Online Monitoring / Continuous Monitoring” clauses
Check your Environmental Clearance conditions (if applicable)
Check any directions issued by CPCB/SPCB to your sector or industrial area
If OCEMS is mentioned in your consent or directions, treat it as a compliance system - not just instrumentation.
What This Means for Modern EHS Teams
As monitoring systems evolve, the role of environmental professionals inside industrial plants is also gradually changing.
Traditionally, environmental compliance activities were largely centred around coordinating monitoring activities and maintaining regulatory documentation.
Typical responsibilities included:
scheduling third-party monitoring visits
maintaining stack monitoring reports
submitting environmental statements and returns
maintaining consent compliance records
While these activities remain important, the introduction of continuous monitoring systems has added another dimension to environmental compliance.
EHS teams increasingly find themselves managing not only environmental parameters but also the reliability of monitoring systems and the integrity of emission data.
In practical terms, this often involves tasks such as:
reviewing OCEMS dashboards regularly
tracking system uptime and data availability
coordinating periodic analyzer calibration
verifying DAHS data transmission
documenting technical interruptions or maintenance events
This shift means environmental compliance is no longer limited to environmental science and laboratory coordination. It now also involves elements of data management, system diagnostics, and monitoring reliability.
Many experienced EHS professionals describe this transition as a gradual movement from traditional monitoring roles toward environmental data stewardship.
Plants that adapt to this shift early usually experience fewer surprises during inspections or regulatory reviews.
A Practical Readiness Check for Factories
Because continuous monitoring systems generate large volumes of data, even small technical issues can occasionally create questions during compliance reviews.
A simple internal review conducted periodically can help plants identify such issues early.
Some practical checks that many facilities find useful include:
| Area to Review | What to Verify | Red Flags to Watch For |
|---|---|---|
| OCEMS System Uptime | System operates consistently; downtime is recorded with reason | Unexplained gaps; repeated daily outages; long downtime without documentation |
| Analyzer Calibration | Calibration schedule is followed; records are complete | Skipped calibrations; drift that keeps increasing; no documented corrective actions |
| DAHS Data Transmission | Data is reaching the regulator server consistently | Data stuck in local buffer; sync failures; frequent “no data received” messages |
| Manual vs Continuous Trends | Compare manual report range with OCEMS trend behaviour | Manual shows stable compliance but OCEMS shows persistent high values or abnormal patterns |
These checks are not intended to replace regulatory requirements. Instead, they serve as a preventive review process that helps plants maintain confidence in their monitoring systems.
Small observations made during internal checks often prevent larger questions later during regulatory inspections or data reviews.
What to Do Right Now
If your plant is already facing questions about OCEMS data, start with the basics.
If you already received a query or observation
Pull the relevant OCEMS period from your local DAHS records.
Compare that period with what was actually visible on the regulator-side record.
Check whether the issue relates to calibration, flatline behaviour, or data transmission.
Match the flagged period against plant operating conditions, shutdowns, maintenance activity, or process disturbances.
Keep supporting records ready before responding.
If you are reviewing the system proactively
Compare your last few manual monitoring reports with OCEMS trend behaviour for the same periods.
Review calibration schedules and confirm that corrective actions are documented.
Check whether server-side data availability is being reviewed regularly, not just local DAHS availability.
Assign ownership for OCEMS health checks within the plant team.
Treat repeated data issues as compliance signals, not only instrumentation issues.
The Bigger Shift in Environmental Monitoring
Across many industrial sectors, environmental monitoring is slowly transitioning from a system based primarily on periodic measurement to one that also includes continuous digital observation.
This shift reflects broader changes in how environmental performance is evaluated.
| Earlier Monitoring Approach | Emerging Monitoring Approach |
|---|---|
| Periodic laboratory reports | Continuous monitoring systems |
| Paper-based documentation | Digital environmental data streams |
| Inspection-driven evaluation | Data-assisted regulatory oversight |
The goal of this transition is not to replace traditional monitoring methods but to strengthen environmental transparency and accountability.
When manual monitoring and continuous monitoring are interpreted together, they provide a more complete understanding of how emissions behave under real operating conditions.
Final Thought
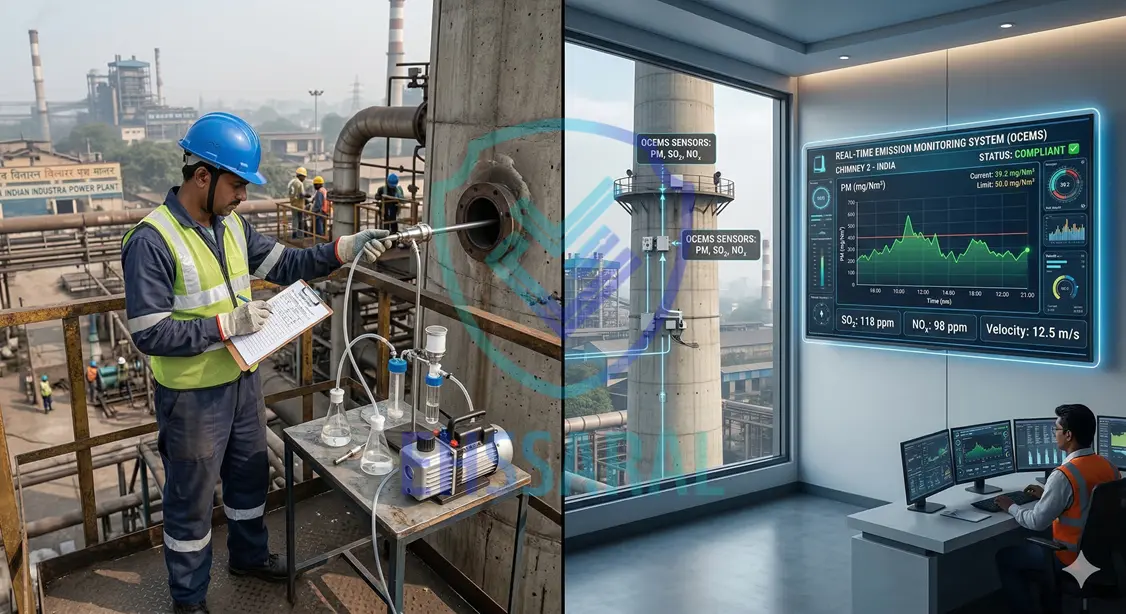
Manual stack monitoring and OCEMS should not be viewed as competing approaches. Each serves a different purpose.
Manual monitoring provides a carefully controlled measurement during a defined sampling window. OCEMS provides a continuous record of how emissions and monitoring behaviour appear across the wider operating cycle of the plant.
The gap between the two is where many compliance discussions now begin.
Plants that understand this difference early are usually better prepared to explain data patterns, respond to queries, and strengthen internal compliance reviews before the issue reaches a hearing or inspection stage.
To understand the broader shift pushing industries toward digital monitoring, read The Digital Compliance Cliff for MSMEs in India.
For issue-specific troubleshooting, refer to OCEMS Data Gap CPCB Rejection Guide and CPCB OCEMS Flatline Notice Response Guide.
This article is based on real monitoring practices observed across Indian industries and reflects practical field-level differences between laboratory testing and continuous monitoring systems.
Quick Summary
Manual monitoring = snapshot
OCEMS = continuous data
Differences are normal if systems are understood
Most issues arise from calibration, transmission, or operational variation
FAQs
Why does OCEMS show different values than manual stack monitoring?
OCEMS measures emissions continuously, capturing variations during startup, load changes, and disturbances. Manual monitoring captures only a limited sampling window.
Is OCEMS more accurate than manual monitoring?
Both systems are accurate when maintained properly. However, OCEMS provides a broader picture because it records emissions continuously.
What is OCEMS data gap?
An OCEMS data gap occurs when emission data does not reach the regulator’s server due to transmission or system issues.
What is a flatline in OCEMS?
A flatline occurs when emission values remain constant for long periods, often indicating sensor or system issues.
Is OCEMS mandatory in India?
OCEMS is required for certain industries based on CPCB directions, SPCB consent conditions, or environmental clearance requirements.


 Practical Guide for Indian Factories EHSShala.webp)