Form 5 Environmental Statement India: Example & Mistakes
Form 5 Environmental Statement Environmental Compliance India Hazardous Waste Management EHS Compliance Pollution Control Board India Environmental Reporting Industrial Compliance
Last updated:
|9 Jun 2026
Read time: 20 min read
Form 5 Environmental Statement is an annual report submitted by industries in India under Environmental Protection Rules. It includes water consumption, raw material usage, pollution discharge, waste generation, and pollution control measures, helping regulators assess a plant’s environmental performance.
Quick Summary
- Form 5 is a performance reflection, not just a form
- Data linkage is more important than individual values
- Form 4 vs Form 5 mismatch is a major risk
- Monthly tracking reduces effort and errors
- Good data → smoother compliance and reporting
Why This Topic Needs Clarity
In many Indian plants, Form 5 is handled in a familiar way.
- Data is requested from different departments at the last moment
- Old formats are opened and values are adjusted
- Units are converted in a hurry
- Submission is done just before the deadline
On paper, everything looks complete.
But during inspections, this is where questions start.
Because from a practical standpoint, Form 5 is not just a document.
It is one of the few places where your entire environmental performance comes together in one view.
And when all data comes together - inconsistencies also become visible.
What is Form 5 Environmental Statement? (Simple Explanation)
Form 5 is an annual environmental performance report that certain industries in India are required to submit under the Environmental (Protection) Rules.
It typically includes:
- Water consumption
- Raw material usage
- Pollution discharge
- Hazardous waste generation
- Solid waste details
- Pollution control measures
Most professionals see it as:
“A form we need to fill every year”
But from an operational perspective, it is closer to:
“A summary of how efficiently and consistently your plant is managing environmental resources”
See here Environmental Statement Form V pdf
Who Needs to Submit Form 5
In general, Form 5 is applicable to:
- Industries requiring Consent under Pollution Control Boards
- Units falling under specified categories notified by authorities
- Plants with significant resource consumption or waste generation
The exact applicability may vary slightly by state, but in day-to-day operations:
If your plant has ETP, hazardous waste, or significant water usage -
you are most likely required to submit Form 5.
ETP & STP Troubleshooting: The Complete Indian Guide
Form 5 Submission Due Date
Form 5 Environmental Statement is generally required to be submitted on or before 30 September every year for the financial year ending on 31 March.
For example:
| Financial Year | Form 5 Due Date |
|---|---|
| 2025–26 | 30 September 2026 |
| 2026–27 | 30 September 2027 |
Many industries begin compiling data only a few weeks before the deadline. In practice, this is one of the biggest reasons for data mismatches, missing records, and last-minute corrections.
A better approach is to reconcile production, water consumption, hazardous waste generation, and monitoring data throughout the year so that Form 5 becomes a verification exercise rather than a data reconstruction exercise.
Why Form 5 Matters More Than It Appears
This is where most confusion begins.
Many plants operate with this assumption:
“If our results are within limits, compliance is fine.”
But Form 5 is not about limits.
It is about consistency and linkage across data.
Over the years, we’ve seen that Form 5 is often used by inspectors to:
- Compare year-on-year trends
- Cross-check with:
- Form 4 (Hazardous Waste Return)
- Monitoring reports
- Consent conditions
- Identify gaps in data tracking
For example:
- If your water consumption increases significantly
but your wastewater generation remains the same
→ it raises a question - If hazardous waste quantity in Form 5
does not match Form 4
→ it becomes a discussion point
This is why:
Form 5 does not create compliance.
It only reveals how strong your internal tracking system is.
Read more about Environmental Compliance Checklist by our Perfect Pollucon Team
The Real Challenge: Data Is Never in One Place
In day-to-day plant operations, environmental data does not sit in one system.
It is spread across:
- Production records
- Utility logbooks
- ETP/STP logs
- Hazardous waste manifests
- Store/dispatch records
- Lab analysis reports
Each department maintains its own version.
When Form 5 preparation starts:
- Data is collected manually
- Numbers are adjusted to match expected outputs
- Assumptions are made where data is missing
This is why Form 5 becomes:
- A 3-5 day exercise in many plants
- Instead of a 30-60 minute compilation task
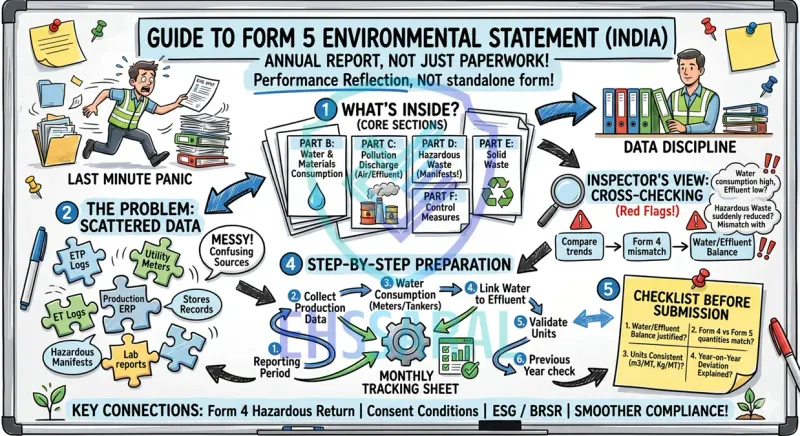
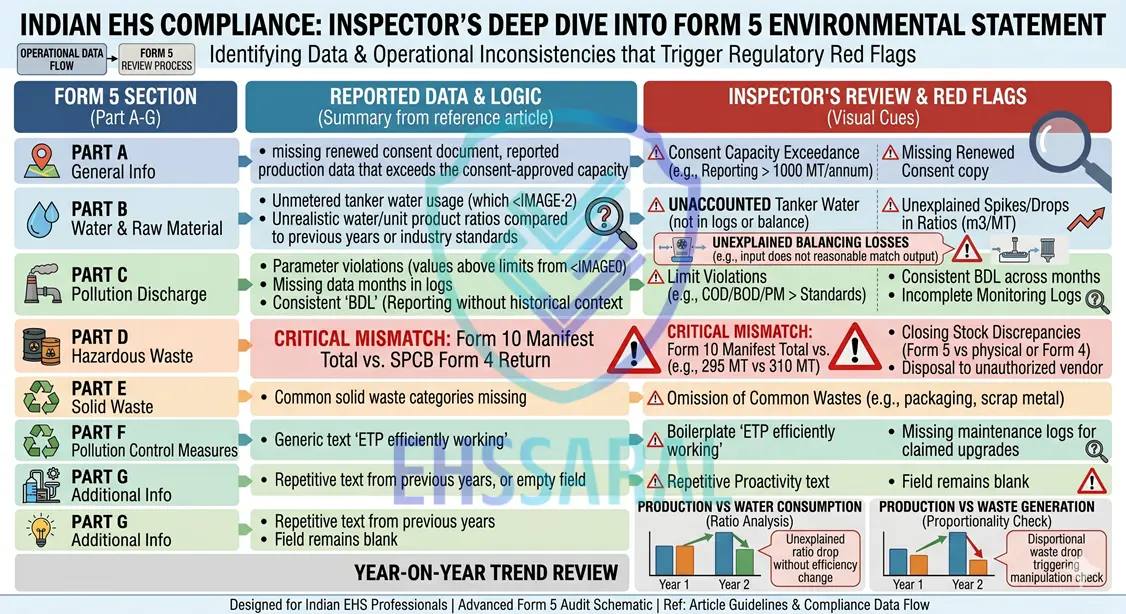
Understanding the Structure of Form 5
Before going into calculations, it helps to understand what each section is trying to capture.
Part A - General Information
Basic details:
- Industry name and address
- Products manufactured
- Consent details
This section seems simple, but even here:
- Product details must align with consent
- Capacity should match actual operations
Part B - Water and Raw Material Consumption
This is one of the most important sections.
It includes:
- Total water consumption
- Water usage per unit of product
- Raw material consumption
From a practical standpoint, this section answers:
“How efficiently is your plant using resources?”
Part C - Pollution Discharge
Details related to:
- Effluent generation
- Air emissions
- Comparison with standards
This is where:
- Monitoring results
- Consent limits
- Actual discharge values
all come together.
Part D - Hazardous Waste
This section captures:
- Type of hazardous waste
- Quantity generated
- Method of disposal
This must align closely with Form 4.
Part E - Solid Waste
Non-hazardous waste details:
- Quantity generated
- Disposal method
Often overlooked, but still important for completeness.
Part F - Pollution Control Measures
Information on:
- Treatment systems
- Upgrades or changes made
- Efficiency improvements
What Auditors Often Expect in Part F
Part F is not only about listing pollution control equipment or environmental initiatives. It is also intended to demonstrate whether those measures resulted in measurable environmental improvements.
Examples include:
- Reduction in fresh water consumption
- Lower hazardous waste generation
- Improved solvent recovery
- Reduced fuel consumption
- Better recycling or reuse rates
Where possible, industries should quantify these improvements.
| Initiative | Environmental Benefit | Cost Impact |
|---|---|---|
| Condensate recovery system | Reduced fresh water consumption | Lower water procurement cost |
| Solvent recovery unit | Reduced hazardous waste generation | Lower raw material purchase cost |
| LED lighting conversion | Reduced electricity usage | Lower energy bills |
| Process optimization | Reduced chemical consumption | Reduced operating cost |
Many organizations focus only on environmental benefits. However, documenting both environmental and operational benefits often creates a stronger environmental performance narrative.
Part G - Additional Information
Any extra details:
- Process improvements
- Waste reduction efforts
- Environmental initiatives
Download Form 5 Environmental Statement Format (PDF, Word & Filled Sample)
Many EHS professionals search for a ready-to-use Form 5 format while preparing their annual environmental statement.
To make the process easier, we have provided downloadable versions of:
- Form 5 Environmental Statement PDF Format
- Form 5 Environmental Statement Word Format
- Filled Form 5 Sample for Reference
- Environmental Statement Form V (See Rule 14)
These formats can help you understand the structure of the form, required information, and the type of data typically reported during annual submission.
Available Downloads
- Form 5 Environmental Statement PDF Download
- Form 5 Environmental Statement Word Format Download
- Filled Form 5 Environmental Statement Sample
- Environmental Statement Form V (See Rule 14) Format
Before Using Any Sample
The sample provided is intended only for educational and reference purposes.
Every industry has different:
- Manufacturing processes
- Water consumption patterns
- Hazardous waste categories
- Pollution control systems
Always verify that the information reported in your Form 5 matches your actual plant records, consent conditions, monitoring reports, and hazardous waste returns.
Practical Tip
Many industries use previous year's Form 5 as a starting point. While this may save time, values should never be copied without verification.
- In many inspections, regulators compare Form 5 data with production records, monitoring reports, and hazardous waste returns. Ensuring consistency across all records is often more important than simply filling the format correctly.
Download Form 5 PDF environmental statement blank format pdf.pdf Download ⬇
Download Form 5 word environmental statement blank format word.docx Download ⬇
Download Form-V-Sample-Final-Filled Form 5 Sample PDF.pdf Download ⬇
People Also Search For
- Form 5 environmental statement filled sample PDF download
- Form 5 environmental statement word format
- FORM V environmental statement PDF
- Form 5 environmental statement sample
- Form 5 environmental statement template
- Environmental Statement Form V (See Rule 14)
- Form 5 environmental statement format latest version
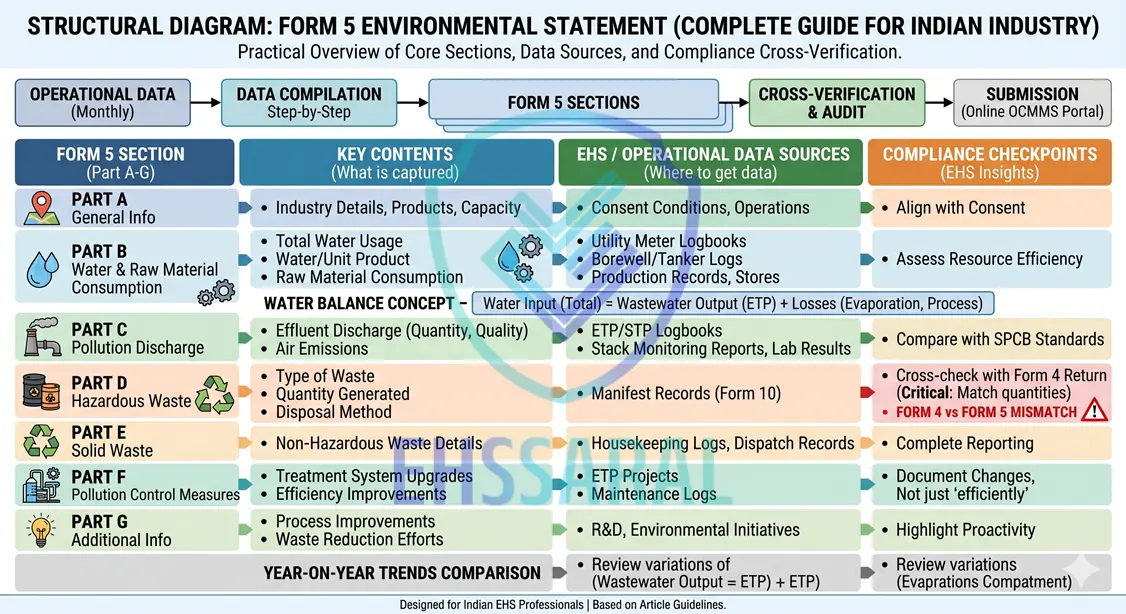
Where Your Data Actually Comes From
Before filling anything, one clarity is required:
Form 5 is not filled from one source.
It is built by connecting multiple datasets.
Here is how it typically maps in a real plant:
| Data Required | Source in Plant | Used In Form 5 Section |
|---|---|---|
| Water consumption | Utility meter logbook | Part B |
| Production quantity | Production records / ERP | Part B |
| Raw material usage | Stores / purchase records | Part B |
| Effluent generation | ETP logbook | Part C |
| Air emissions | Stack monitoring reports | Part C |
| Hazardous waste | Manifest records | Part D |
| Solid waste | Housekeeping / dispatch logs | Part E |
This is where confusion usually starts.
Because:
- These records are maintained by different teams
- Units may not match
- Time periods may differ
Unless this mapping is clear:
Form 5 becomes guesswork instead of reporting.

Step-by-Step Method to Prepare Form 5
Instead of jumping directly into the form, a structured approach works better.
Step 1: Fix the Reporting Period
Ensure:
- All data is from the same financial year
- No overlap or missing months
Step 2: Collect Production Data First
This becomes the base.
Because:
- Water consumption
- Waste generation
- Efficiency
all depend on production quantity.
Step 3: Compile Water Consumption
From:
- Borewell records
- Tanker records
- Municipal supply
Ensure:
- Total matches meter readings or bills
Step 4: Link Water to Effluent
This is a key check.
In most plants:
Water in ≠ Water out (due to evaporation, product usage)
But:
- Large mismatch without explanation → questions
Step 5: Compile Hazardous Waste Data
From:
- Manifest copies
- Disposal records
Cross-check:
- Opening stock
- Generated
- Disposed
- Closing stock
Step 6: Validate Units
One of the most common issues.
Examples:
- Liters vs m³
- Kg vs MT
Even small mistakes here create big inconsistencies.
Step 7: Cross-Check with Previous Year
Inspectors often compare trends.
So check:
- Sudden spikes
- Sudden drops
- Efficiency improvements
If changes exist:
- Be ready with explanation
Read more about Why Form 4 & Form 5 Numbers Don’t Match - Real Industry Reasons
Important Reality: Online Submission Systems (OCMMS)
Earlier, Form 5 was submitted physically.
Now, most State Pollution Control Boards use:
- Online portals (OCMMS or similar systems)
From a practical standpoint:
- Data fields may be slightly different
- Some values may need rounding
- Upload formats may vary
This creates a new challenge:
Even if your calculations are correct,
formatting errors during portal entry can create inconsistencies.
Practical Example - How a Chemical Plant Actually Fills Form V
To make this real, let’s take a mid-sized chemical manufacturing unit.
Plant Profile (Example Scenario)
- Industry Type: Bulk chemical manufacturing
- Products: Solvent-based intermediates
- Annual Production: 1,200 MT
- Water Sources: Borewell + Tanker
- Treatment Systems: ETP + Scrubber system
- Hazardous Waste: Sludge, spent solvents, contaminated containers
Step 1: Start with Production Data (Base Reference)
| Month | Production (MT) |
|---|---|
| Apr-Jun | 280 |
| Jul-Sep | 320 |
| Oct-Dec | 300 |
| Jan-Mar | 300 |
| Total | 1,200 MT |
This number is critical because:
All consumption and waste generation ratios depend on this.
Step 2: Water Consumption Calculation
Source-wise Water Data
| Source | Annual Consumption |
|---|---|
| Borewell | 9,000 m³ |
| Tanker | 3,000 m³ |
| Total | 12,000 m³ |
Water Consumption per Unit
This goes into Part B of Form 5.
Practical Insight
In many plants:
- Borewell data is from meter
- Tanker data is estimated
If tanker data is not recorded properly:
→ Total water consumption becomes unreliable
→ This affects all downstream calculations
Step 3: Effluent Generation (ETP Data)
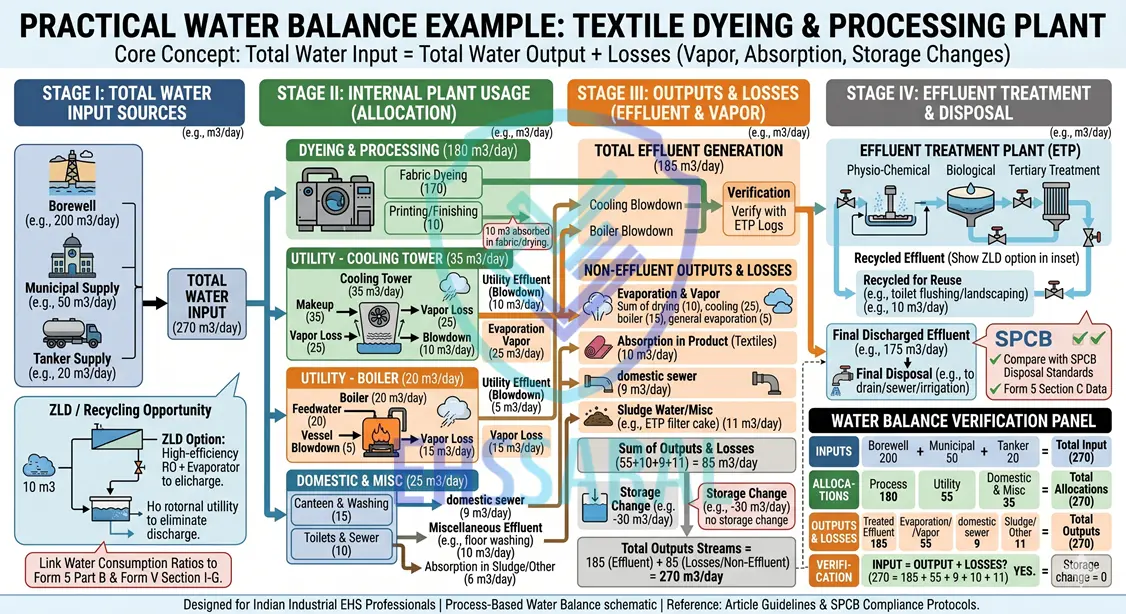
ETP Log Summary
| Parameter | Value |
|---|---|
| Total Effluent Generated | 8,400 m³ |
| Treated & Discharged | 7,800 m³ |
| Loss (evaporation, process) | 600 m³ |
Key Check (Very Important)
Compare:
- Water input = 12,000 m³
- Effluent output = 8,400 m³
Difference = 3,600 m³
This difference should be explainable through:
- Cooling tower losses
- Boiler usage
- Process consumption
If not explained:
This is one of the first questions during inspection.
Step 4: Air Emissions (Simplified)
From stack monitoring reports:
| Parameter | Observed Value | Standard |
|---|---|---|
| PM | 110 mg/Nm³ | 150 mg/Nm³ |
| SO₂ | 60 mg/Nm³ | 100 mg/Nm³ |
This goes into Part C.
Read more Stack Monitoring Basics for Indian Factories by EHSShala
Practical Reality
Inspectors don’t just see:
- “Within limit”
They also see:
- Frequency of monitoring
- Consistency across reports
Step 5: Hazardous Waste Data (Critical Section)
Types of Waste
| Waste Type | Quantity Generated (MT/year) | Disposal Method |
|---|---|---|
| ETP Sludge | 180 | TSDF |
| Spent Solvent | 90 | Recycling |
| Contaminated Containers | 25 | Authorized vendor |
Total Hazardous Waste = 295 MT
Now Comes the Most Important Cross-Check
Form 4 vs Form 5
Let’s assume:
- Form 4 total hazardous waste = 310 MT
- Form 5 total hazardous waste = 295 MT
Difference = 15 MT
What Happens in Real Inspection
Inspector will ask:
- Why mismatch?
- Where is the missing 15 MT?
- Is stock accounted?
Even if everything else is perfect:
This single mismatch can lead to queries or notices.
How Form 5 Reporting Differs Across Industries
| Industry | Key Resource Tracked | Key Waste Stream | Typical Focus Area |
|---|---|---|---|
| Chemical Manufacturing | Water, solvents | ETP sludge, spent solvents | Water balance and hazardous waste |
| Textile Processing | Water, dyes, chemicals | ETP sludge | Water consumption per unit production |
| Pharmaceuticals | Solvents, purified water | Process residue and sludge | Solvent recovery and waste minimization |
| Food Processing | Water and steam | Organic sludge | Water efficiency and organic waste management |
| Engineering Industry | Oils and coolants | Used oil and contaminated cotton waste | Hazardous waste tracking and disposal |
Every industry uses the same Form 5 format. However, the data sources, waste streams, and environmental priorities can vary significantly. This is one reason why copying another industry's filled sample often creates reporting errors.
Where This Difference Usually Comes From
In many Indian plants:
- Opening/closing stock not considered properly
- Manifest data incomplete
- Multiple waste categories merged incorrectly
Waste Characterization Matters More Than Quantity
Many industries focus only on reporting the quantity of waste generated. However, auditors and regulators are often interested in understanding the nature of the waste as well.
For example, two facilities may each generate 100 MT of waste annually, but the environmental implications can be very different depending on composition and disposal method.
| Waste Type | Typical Composition | Common Disposal Route |
|---|---|---|
| ETP Sludge | Metal hydroxides, organics, suspended solids | TSDF |
| Used Oil | Lubricants and hydrocarbons | Authorized recycler |
| Spent Solvent | Organic solvents | Recovery or recycling |
| E-Waste | Circuit boards, electronic components | Authorized dismantler |
| Contaminated Containers | Residual chemicals and packaging | Authorized recycler |
From a practical standpoint, proper waste characterization improves disposal planning, strengthens record keeping, and helps ensure consistency between Form 4, manifests, disposal certificates, and Form 5 reporting.
Step 6: Solid Waste (Often Ignored)
| Waste Type | Quantity |
|---|---|
| Packaging waste | 40 MT |
| Scrap material | 20 MT |
Even though non-hazardous:
- Should be reported correctly
- Should match internal records
Step 7: Pollution Control Measures
Typical entries:
- ETP upgraded with additional aeration
- Scrubber efficiency improved
- Regular maintenance carried out
Practical Tip
Avoid writing:
- “System working efficiently”
Instead write:
- What was improved
- What was maintained
- What changed from last year
Where Things Usually Start Going Wrong
Based on real observations:
1. Data Collected at Last Moment
- Departments give rough numbers
- No time for reconciliation
2. Unit Conversion Errors
- Liters vs m³
- Kg vs MT
Small mistake → large inconsistency
3. Form 4 vs Form 5 Mismatch
- Most common trigger point
4. Unrealistic Efficiency Improvements
Example:
- Last year water consumption = 12 m³/MT
- This year = 6 m³/MT
Without explanation → looks suspicious
5. Copy-Paste from Previous Year
Very common.
But:
- Production changes
- Waste changes
If numbers don’t reflect this:
It becomes visible immediately.
How Inspectors Actually Read Your Form 5
This is where understanding changes everything.
Inspectors usually don’t read Form 5 line-by-line first.
They look for:
1. Trends
- Is water consumption stable?
- Is waste generation proportional to production?
2. Cross-Linking
They mentally connect:
- Production vs waste
- Water vs effluent
- Form 4 vs Form 5
3. Red Flags
- Sudden drops in waste
- Sudden efficiency improvement
- Missing categories
Common Red Flags That Raise Questions During Inspection
- Water consumption increased, but production stayed same
- Hazardous waste suddenly reduced without process change
- Form 4 and Form 5 quantities don’t match
- Effluent generation too low compared to water input
- Efficiency improvement without any modification
One Important Reality
From experience:
Inspectors trust patterns more than numbers.
If your data shows:
- Consistency
- Logical flow
Even minor deviations can be explained.
But if data looks disconnected:
- Even correct numbers raise doubt
When Things Go Wrong During Inspection
Let’s take a real-type scenario.
Situation
Inspector notices:
- Water consumption high
- Effluent generation low
Typical Reaction in Plants
- Panic
- Searching for logs
- Calling different departments
Better Approach
If prepared:
- Show water balance explanation
- Show process usage
- Show logbook consistency
What Saves You
- Monthly records
- Clear calculations
- Consistent units
A Simple Timeline That Actually Works
In many plants, Form 5 starts in March.
That’s the root problem.
Better Approach
| Time | Activity |
|---|---|
| Throughout year | Monthly data recording |
| Jan-Feb | Preliminary compilation |
| March | Reconciliation |
| Before submission | Final validation |
Practical Checklist Before Submitting Form 5
In day-to-day operations, teams focus on filling the format.
But from a practical standpoint, submission should only happen after validation.
Here is a simple checklist that works in real plant conditions:
1. Production vs Resource Consumption
- Does water consumption align with production levels?
- Any sudden increase or drop explained?
2. Water vs Effluent Balance
- Total water input vs total effluent output
- Difference justified through:
- Evaporation
- Boiler/cooling usage
- Product absorption
3. Form 4 vs Form 5 Alignment (Critical Check)
- Hazardous waste quantities match?
- Opening and closing stock considered?
- Categories aligned correctly?
In many inspections, this is the first cross-check done.
4. Unit Consistency
- m³ vs liters
- MT vs kg
Check every value once again.
5. Year-on-Year Comparison
- Any major deviation?
- If yes → explanation ready?
6. Supporting Documents Ready
- ETP logs
- Water meter readings
- Manifest copies
- Monitoring reports
Because during inspection:
Data without backup is treated as assumption.
What If Data Is Missing or Incomplete?
This is a common real-world situation.
In many plants:
- Logs are incomplete
- Records are scattered
- Some months are missing
Typical Mistake
- Adjusting numbers to “make sense”
- Copying previous year data
This creates:
- Short-term comfort
- Long-term risk
Better Practical Approach
If data is genuinely missing:
- Use best possible estimate based on available records
- Maintain internal note explaining assumption
- Ensure consistency across all related sections
Example:
If tanker water records are missing:
- Estimate based on number of tankers
- Ensure this matches overall water balance
Important Insight
Inspectors are more comfortable with explained estimates
than perfect but inconsistent numbers
How Form 5 Connects to Overall Compliance
Many professionals treat Form 5 as a standalone document.
But in reality, it sits at the center of multiple compliance layers.
1. Link with Form 4 (Hazardous Waste Return)
- Quantities must match
- Categories must align
Mismatch → immediate query
2. Link with Monitoring Reports
- Effluent values
- Emission data
Should align with submitted reports
3. Link with Consent Conditions
- Production capacity
- Resource limits
If production exceeds consent capacity:
- It reflects indirectly in Form 5
4. Link with Internal Audits / ISO 14001
For plants following ISO 14001:
- Form 5 data supports:
- Environmental objectives
- Performance tracking
- Resource efficiency
Form 5 and ESG / BRSR - A Growing Connection
This is an emerging shift in many Indian companies.
Earlier:
- Form 5 = compliance requirement
Now:
- Same data = used for ESG and sustainability reporting
Examples
- Water consumption → Water intensity metrics
- Waste generation → Waste reduction targets
- Energy usage → Carbon footprint calculations
Practical Meaning
If Form 5 data is:
- Accurate → ESG reporting becomes easier
- Inconsistent → reporting becomes difficult
Simple Way to Understand
Form 5 is the base layer of environmental data
for future sustainability reporting
How to Make Form 5 Easy (Instead of Stressful)
From experience, there is a clear difference between two types of plants.
Type 1: Reactive Approach
- Data collected at year-end
- Multiple corrections
- High stress
- High risk of mismatch
Type 2: Structured Approach
- Monthly tracking
- Data already aligned
- Minimal effort at year-end
The Difference Is Simple
Not expertise.
Not software.
It is:
Whether data is tracked regularly or not.
A Simple System That Works in Practice
Without overcomplication, even a basic system can help.
Monthly Tracking Sheet Should Include:
- Production quantity
- Water consumption
- Effluent generation
- Hazardous waste generated
- Disposal details
If this is updated monthly:
- Form 5 becomes a summary
- Not a reconstruction exercise
- In many plants, this tracking is done manually in Excel - which is where gaps usually start appearing.
Final Practical Takeaway
In many Indian plants, Form 5 is seen as:
- A yearly task
- A format to be filled
But over the years, one pattern is clear:
Plants that struggle with Form 5
are not struggling with the form -
they are struggling with data discipline.
Closing Thought
Form 5 is not something you prepare in March.
It is something you build:
- Every month
- Every record
- Every logbook entry
When this is done right:
- Submission becomes simple
- Inspections become smoother
- Confidence improves across the team
Frequently Asked Questions (Practical Answers)
1. Can we estimate values in Form 5?
Yes, if exact data is not available.
But:
- Estimation should be reasonable
- Should be consistent across sections
- Should be explainable
2. What if Form 5 has mistakes after submission?
In many cases:
- Clarification can be provided during inspection
But:
- Frequent inconsistencies reduce credibility
In most SPCBs:
- Direct revision option is limited
- Clarification happens during inspection or email
3. Do we need separate Form 5 for each product?
Usually:
- One consolidated Form 5 is submitted
But:
- Data may internally be tracked product-wise
4. How to handle seasonal production variation?
- Use annual totals
- Ensure variation reflects logically in consumption and waste
5. Can Form 5 be revised?
Depends on SPCB process.
In practice:
- Corrections are usually handled during inspections or clarification
6. What is the most common mistake in Form 5?
Mismatch between:
- Form 4
- Form 5
- Internal records
7. Is “within limits” enough for compliance?
No.
Compliance also depends on:
- Data consistency
- Monitoring frequency
- Record accuracy

Harshal T Gajare
Founder, EHSSaral
Founder - EHSSaral| Partner - Perfect Pollucon | ISO 14001 Lead Auditor | Second-generation environmental professional simplifying EHS compliance for Indian manufacturers through practical, tech-enabled guidance.
Related Blogs
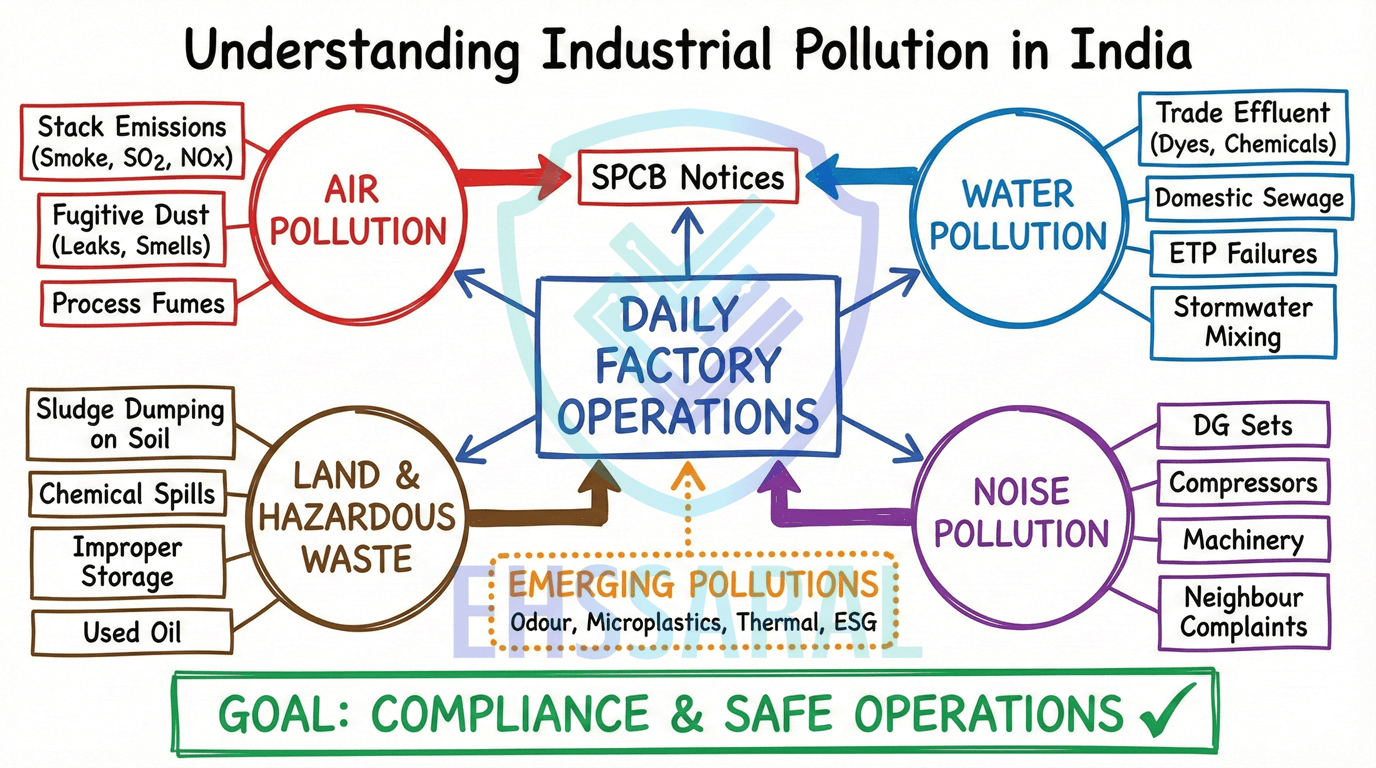
Types of Pollution in Industries Expert Guide | EHSShala
Environmental Laws in India (Complete Guide) | EHSShala
 Guide for Indian Factories EHSShala by EHSSaral.webp)
Ambient Air Quality Monitoring (AAQM) Guide for Indian Factories | EHSShala
Chemical Accidents Rules, 1996: A Practical Guide for Indian EHS Officers
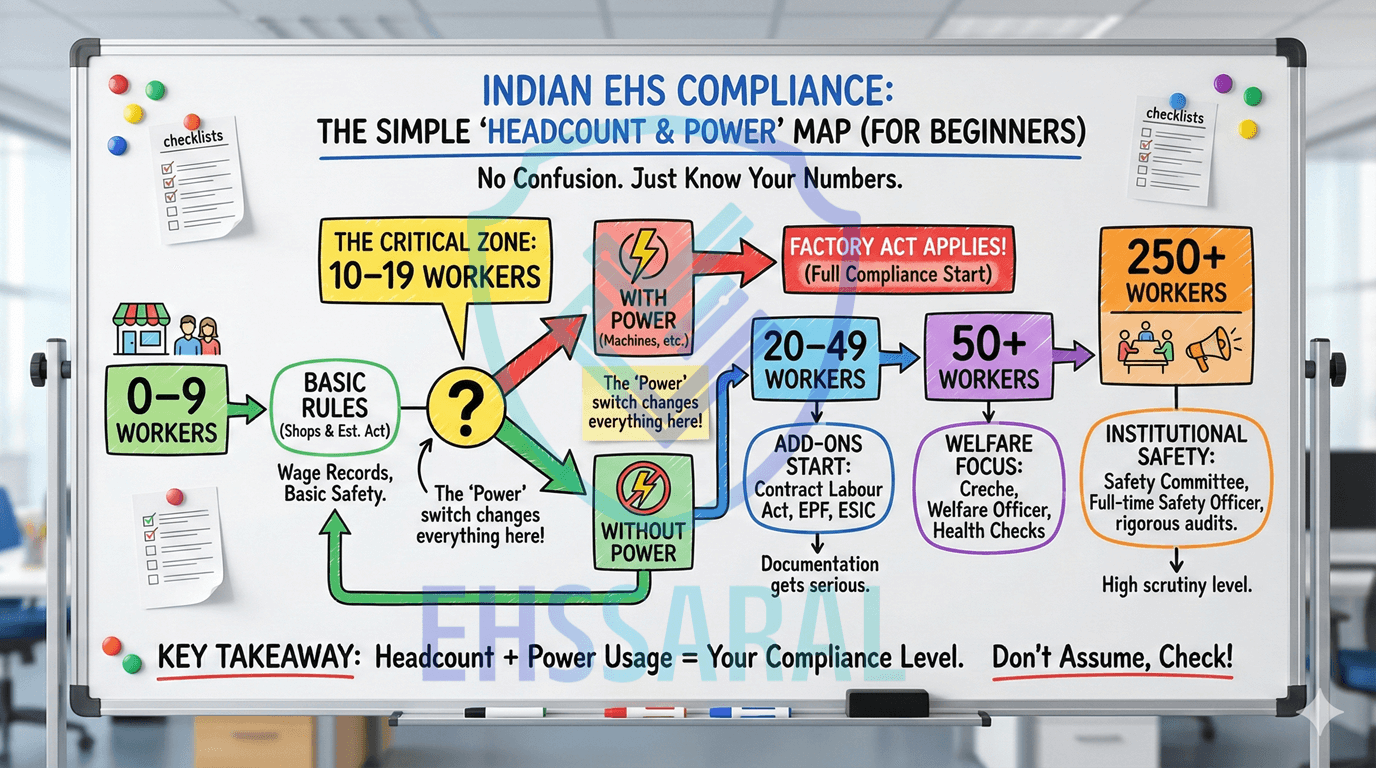
Factory Act & Compliance Thresholds: What Applies to Your Headcount? | EHSSaral

Transforming SME Compliance: Zero Surprise Failures in India | EHSSaral Research

EHSShala Consent - SPCB Consent System Explained| EHSShala
Environmental Compliance Calendar Software – Simplify MPCB Renewals & Due Dates | EHSSaral