If you ask a senior EHS officer what changed in the last 5–7 years, he will not say “rules changed.”
He will say:
“Visibility increased.”
Earlier, environmental monitoring in many factories meant:
Call the lab
Take sample
Receive report
File it
If the value was within limit, everyone relaxed.
That approach worked for years.
Until systems became connected.
Today:
OCEMS data is visible remotely
Complaints reach faster
Renewals are scrutiny-based
Data mismatches are easily noticed
Now monitoring is not just about generating a report.
It is about proving that your process is under control - consistently.
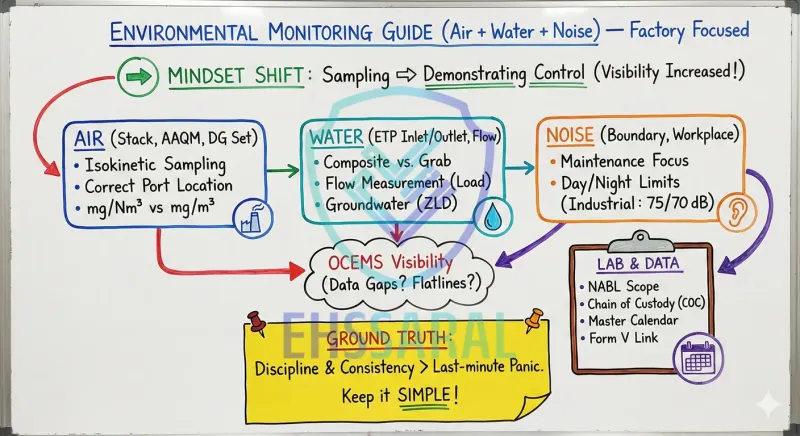
“Monitoring is no longer about sampling. It is about demonstrating control.”
That is the mindset shift.
And once you understand this shift, monitoring becomes less stressful.
Because control is predictable.
What Exactly Is Environmental Monitoring? (In Factory Language) Let’s remove textbook words.
Environmental monitoring simply means:
Checking whether what leaves your factory
That’s it.
It includes:
Stack emissions from boilers, furnaces, DG sets
Ambient air around your premises
Treated effluent from ETP/STP
Noise levels at boundary and workplace
Monitoring is not punishment.
Monitoring is a feedback system.
If pH is drifting, it tells you process is drifting.
Monitoring is your early warning system.
Factories that understand this rarely panic during inspection.
Factories that treat monitoring as “lab work” usually panic.
Compliance Monitoring vs Process Monitoring - Understand the Difference Many juniors get confused here.
There are two types of monitoring happening in factories:
1. Process Monitoring (Internal) This includes:
This is done by plant team.
Purpose?
To keep the system running properly.
This data is usually not submitted to the Board.
But this data saves you during inspection.
2. Compliance Monitoring (Third-Party) This includes:
This is usually done by an external lab.
Purpose?
To legally demonstrate compliance.
Both are required.
If you only do third-party monitoring, you are reacting.
If you only do internal monitoring, you have no legal proof.
Internal monitoring keeps you safe.
Understand this clearly.
It removes frustration.
The Three Core Areas of Environmental Monitoring In Indian factories, monitoring usually falls into three main areas:
Air
Water
Noise
But not all three create equal anxiety.
Let’s be honest.
In most Red category industries, anxiety ranking looks like this:
Stack emissions
Effluent discharge
OCEMS data
Noise
So we will treat them in that order of seriousness.
Read more CPCB Technical Guidelines for Environmental Monitoring
Air Monitoring - Where Most Panic Happens Air monitoring usually includes:
Let’s start with the most misunderstood one.
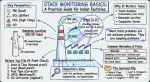
Stack Monitoring - What It Actually Means When a lab team comes for stack monitoring, they are checking:
But what most EHS officers don’t fully understand is how the sampling works.
And because they don’t understand it, they feel helpless.
Let’s simplify.
Stack monitoring is not just “collecting air.”
It involves:
Measuring stack diameter
Measuring gas velocity
Identifying correct traverse points
Maintaining isokinetic conditions
Collecting dust in filter media
If the sampling point itself is wrong, the entire reading becomes questionable.
And many factories have poorly designed sampling ports.
Isokinetic Sampling - In Simple Words This word scares many juniors.
Isokinetic simply means:
The speed at which gas enters the sampling probe
If gas enters slower, heavy dust particles drop out.
If gas enters faster, extra particles get pulled.
So isokinetic sampling ensures accurate dust measurement .
Most stack disputes are not about limits.
They are about sampling design.
That is why sampling platform, port diameter, and straight duct length matter.
In many medium-scale factories, ports are installed just for compliance - not scientifically.
And this comes up during renewal.
Sampling Port & Duct Design - Why Location Matters Even if your lab is excellent, wrong sampling location can make results unreliable.
In simple terms, stack gas should be stable when it is measured.
If sampling port is:
Too close to a bend
The gas flow becomes disturbed.
When flow is disturbed:
Velocity reading becomes inaccurate
That is why straight duct length before and after the port is important.
You do not need to remember exact ratios.
Just remember this:
“Sampling should happen where flow is stable, not where gas is confused.”
During renewal or inspection, poorly located ports often come up as improvement points.
If you are planning new stack installation, involve someone technically aware during design stage - not after construction.
Fixing design later is always costlier.
Common Stack Monitoring Issues Seen in Factories From experience across many units, common issues are:
No safe platform access
Port not at correct height
Insufficient straight duct length
No power socket near platform
Bag filter pressure gauge not working
Same value repeated for multiple quarters
That last one is dangerous.
If your report shows 48 mg/Nm³ every quarter for 2 years, it looks unrealistic.
Small But Important: Close and Grease the Port After monitoring, always ensure:
Sampling port is properly closed
Open or rusted ports send wrong signal.
During inspection, an unused and rusted port silently communicates:
“No recent monitoring.”
It is a small maintenance habit.
But it reflects discipline.
DG Set Emission Monitoring DG sets are often ignored until inspection.
Typical issues:
Acoustic enclosure removed for maintenance
Stack height not as per calculation
No emission testing done after major servicing
Diesel quality variation
Remember:
DG monitoring is usually periodic.
But complaint-driven inspections often check DG first.
Because it is visible and audible.
Ambient Air Quality Monitoring (AAQM) This measures:
Sampling is done near boundary.
Many factories misunderstand this.
They assume if ambient air is high, it means their stack is high.
Not necessarily.
Ambient includes:
Nearby road dust
Construction activity
Neighboring industry
That is why wind direction and sampling location matter.
Ambient air tells the story of the area.
Do not mix the two.
Now that we have covered air monitoring, let’s move to the second biggest anxiety area in most factories:
Water and effluent.
For many Red and Orange category industries, effluent monitoring is not just technical.
It is emotional.
Because water leaves your boundary.
And once it leaves, you cannot take it back.
Water & Effluent Monitoring - Control Starts Inside the ETP Effluent monitoring usually includes:
Inlet sampling
Outlet sampling
Flow measurement
Specific parameters like pH, BOD, COD, TSS, Oil & Grease, heavy metals
But here is the ground truth:
Most effluent problems do not start at the outlet.
They start at process variation.
If raw material changes,
Monitoring only the outlet without understanding inlet load is incomplete.
“Outlet tells you if you passed. Inlet tells you why you failed.”
A strong EHS officer tracks both.
Composite vs Grab Sampling - Common Confusion Many factories mention “composite sample.”
But what does that mean?
Composite sample means:
Multiple samples collected at intervals
If your discharge is continuous, composite sampling gives better representation.
Grab sample means:
Single sample at one time.
In many MSMEs, what is called composite is actually 3–4 grabs mixed casually.
That is not true composite.
During inspection, if timing logs do not match sampling, questions come.
Not punishment.
So keep simple discipline:
These small records reduce major stress later.
Flow Measurement - The Silent Parameter Many EHS officers focus only on concentration (mg/L).
But regulators also see total load.
Load = concentration × flow.
Let’s make this practical:
If COD is 250 mg/L
Total daily COD load becomes:
250 mg/L × 100,000 L
Now imagine:
Same COD concentration
Load becomes 50 kg per day.
So even if concentration is within limit, total pollution load may increase.
That is why flow meter accuracy is important.
Concentration tells part of the story.
If flow meter is not working:
Your discharge data becomes weak
Your annual return numbers become inconsistent
Your water balance becomes doubtful
In many units, flow meters are installed but not calibrated for years.
And it only gets noticed during renewal.
Make flow meter calibration part of your annual calendar.
It is low effort.
Do Not Forget the Water Below You - Groundwater Monitoring In some Red category industries, especially:
ZLD plants
Groundwater monitoring through piezometric wells may be required.
Purpose is simple:
To ensure effluent is not seeping into soil.
If you are Zero Liquid Discharge, the Board may expect proof.
That proof comes from periodic groundwater analysis.
Do not ignore this if mentioned in your consent.
Water above ground is visible.
Water below ground is silent - but important.
Internal Monitoring vs Third-Party (In Water) Daily internal checks may include:
pH
MLSS
DO
Sludge volume index
These are process health indicators.
Third-party lab checks:
COD
BOD
Heavy metals
Other consent parameters
Both are required.
If your internal logbook shows pH between 6.5–7.5 daily
Trend alignment matters.
Noise Monitoring - The Most Ignored, Yet Visible Parameter Noise rarely creates panic.
Until a complaint comes.
Noise monitoring usually includes:
Boundary noise
DG set noise
Workplace noise
Limits differ for:
Industrial area
Commercial area
Residential area
Day and night limits are different.
Common mistakes seen in factories:
Measuring only during working hours
Not adjusting for background noise
No maintenance of acoustic enclosure
No record of previous measurements
Noise is easy to control if maintenance is strong.
It becomes an issue only when ignored for years.
“Noise problems usually indicate maintenance problems.”
Keep it simple:
That is usually sufficient.
For industrial areas, typical limits are:
75 dB during day
Many officers confuse this with commercial limits (65 dB).
Always confirm your area classification.
Also remember:
Noise issues usually arise from complaints, not routine inspection.
If nearby residents complain repeatedly, scrutiny increases.
So preventive maintenance is more important than yearly testing.
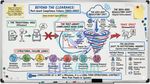
OCEMS - The Real Mindset Shift Now we come to the biggest change in environmental monitoring:
Online Continuous Emission Monitoring Systems (OCEMS)
This is where many juniors feel maximum pressure.
Because data is visible remotely.
Let’s reduce the fear.
OCEMS measures parameters like:
Particulate matter
SO₂
NOx
Flow
pH (in effluent)
COD (in some cases)
And transmits data to the Board server.
That’s it.
But what creates stress?
Data gaps.
Read more about Assessing Effectiveness of India’s Industrial Emission Monitoring Systems
What Does “Flatline” Mean? Flatline means:
Parameter shows same value for long duration.
Example:
PM showing 32 mg continuously for 6 hours.
This is technically unrealistic.
Processes fluctuate.
Flatline usually indicates:
Sensor issue
Probe blockage
Communication freeze
It does not automatically mean violation.
But if not documented, it creates doubt.
Read - Received CPCB OCEMS Flatline Notice?
Data Gap - How to Handle It Calmly Server down.
Data gap can happen.
What matters is documentation.
Keep simple record:
Date
Time
Reason
Corrective action
Service report (if any)
In practice, unexplained data gaps create more queries than exceedance.
Because exceedance can be explained technically.
Learn - OCEMS Data Gaps and Why CPCB Rejects Data & How to Fix it?
When Does OCEMS Trigger Serious Attention? Without discussing penalties or timelines, generally:
Repeated unexplained spikes
Long flatline without maintenance record
Continuous exceedance without corrective action log
That is when things escalate from query to notice.
So focus on:
Documentation.
Not panic.
“OCEMS does not punish you. It exposes your discipline level.”
Factories that review weekly trends internally rarely get surprised externally.
Lab Selection, NABL & Chain of Custody - Where Many Compliance Stories Collapse Now we come to something very practical.
Most monitoring problems in Indian factories do not happen inside the stack.
They happen in coordination with the lab.
Let’s speak openly.
In many units, lab selection is done based on:
Lowest quotation
Fastest turnaround
Known contact
Compliance is rarely the first filter.
That is risky.
Because a lab report is not just paper.
It is legal evidence.
Why NABL Accreditation Matters When a lab says it is NABL accredited , it means:
The lab has been assessed for:
But there is one important detail many officers miss.
NABL accreditation is parameter-specific.
That means:
A lab may be accredited for pH and COD
So before assigning work, always check:
If the report does not carry valid accreditation for that parameter,
And then you have:
Do not verify this during inspection.
Verify before sampling.
State Approval vs NABL - Understand the Difference Some labs are:
Ideally, for compliance monitoring:
This combination reduces future queries.
Managing Your Lab Relationship - Not Just Vendor, But Partner Many EHS officers treat labs as one-time vendors.
Better approach:
Treat them as compliance partners.
Keep clarity on:
One common issue seen:
Lab report shows limit different from consent limit.
Example:
Report compares PM with 150 mg/Nm³
This creates unnecessary confusion.
Before sampling, share:
Small coordination prevents big embarrassment.
Chain of Custody - The Most Ignored Step Now let’s talk about sample handling.
This is where compliance silently breaks.
Example seen in many factories:
Sample taken at 10 AM
Kept on table
Lab collects at 3 PM
No preservation
No seal
Then BOD value changes.
Then lab gets blamed.
Chain of Custody (COC) simply means:
A documented trail of:
Who collected the sample
When it was collected
How it was preserved
When it was handed over
Who received it
For parameters like BOD, COD, heavy metals - timing and preservation matter.
Best practice:
If dispute arises later, COC protects both factory and lab.
“Sample without custody record is only half compliance.”
This small discipline separates average units from professionally managed units.
Calibration & QA - Why Instruments Can Betray You Monitoring accuracy depends on instruments.
Common instruments in factories:
pH meter
DO meter
Flow meter
Stack analyzer
Noise meter
Over time, sensors drift.
Calibration ensures instrument readings match standard reference.
In many MSMEs, calibration certificates are missing or expired.
During inspection, officer may ask:
“When was this calibrated?”
If you cannot answer, doubt increases.
Make simple rule:
Even portable pH meter needs calibration.
Small device.
QA/QC - In Simple Words Quality Assurance (QA) means:
System-level discipline.
Quality Control (QC) means:
Checking actual readings for consistency.
For example:
If internal pH log shows stable values
Do not wait for inspection to discover mismatch.
Trend review once a month saves tension.
Building a Monitoring System That Does Not Depend on Memory Many EHS officers manage monitoring through:
WhatsApp reminders
Personal diary
Memory
This works - until it doesn’t.
Better approach:
Create simple monitoring master sheet.
Include:
Parameter
Location
Frequency
Last done date
Next due date
Lab assigned
Report received (Yes/No)
This reduces panic during renewal.
“Systems reduce panic. Memory increases panic.”
Also maintain:
Keep both:
Physical file
Digital backup
Because inspections may ask for either.
Cost Optimization - How to Reduce Monitoring Cost Without Reducing Compliance EHS officers constantly hear:
“Why so many lab visits?”
There is a smart way to handle this.
Instead of calling lab:
Once for stack
Once for effluent
Once for noise
Bundle monitoring wherever possible.
Plan calendar like this:
Air + Water + Noise on same visit.
Benefits:
But do not compromise frequency requirements.
Bundling is optimization.
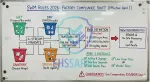
Simple Monitoring Calendar Example You do not need complicated software.
Even a simple sheet like this works:
Parameter Location Frequency Last Done Next Due Lab Status Stack PM Boiler 1 Quarterly Jan 2026 Apr 2026 XYZ Lab Report Received Effluent COD ETP Outlet Monthly Feb 2026 Mar 2026 XYZ Lab Pending Noise Boundary Annual Dec 2025 Dec 2026 ABC Lab Completed
This single table removes 70% of monitoring stress.
Visibility reduces anxiety.
What Inspectors Commonly Check - Ground Reality Let’s remove fear.
Most inspections are structured.
Officers commonly check:
They usually observe trend.
Not just one number.
If your numbers show improvement after corrective action,
If values are always at limit with no variation,
“Perfect numbers every time often look imperfect.”
Be realistic.
Real processes fluctuate.
Monitoring Mistakes Seen Across Many Factories From practical experience, common patterns are:
Monitoring done but report not filed properly
Lab report without signature or seal
Wrong unit (mg/m³ instead of mg/Nm³)
Consent limit misunderstood
No comparison column in report
Same value repeated multiple quarters
Flow meter installed but not working
OCEMS running but not reviewed internally
None of these are criminal.
They are system gaps.
And system gaps can be corrected.
Quick Clarity: mg/Nm³ vs mg/m³ In stack reports, always prefer mg/Nm³.
The “N” means the value is corrected to normal temperature and pressure.
Without this correction, hot gas can show misleading numbers just because volume expands.
So check two things in the report:
Unit shown as mg/Nm³
This small check avoids unnecessary arguments later.
Monitoring Data and Form V - The September Headache Every year, many EHS officers struggle while filing Environmental Statement (Form V).
They search old files.
They reconstruct flow data.
They calculate loads manually.
Why does this happen?
Because daily and monthly monitoring data was not maintained properly.
Your monitoring records are the raw material for Form V.
If daily logs are incomplete, Form V becomes stressful.
If monitoring system is disciplined, Form V becomes mechanical.
Monitoring discipline today saves reporting stress later.
Form 5 Environmental Statement India: Example & Mistakes
Environmental Monitoring & The Future - Why Historical Data Matters Today monitoring is compliance.
Tomorrow it may also become baseline reference.
Whether for:
Historical data becomes valuable only if:
Factories that maintain disciplined records for 3–5 years
Do not think too far.
Just maintain discipline today.
Future benefits follow automatically.
Final Thoughts Environmental monitoring changed because visibility increased.
Data is now traceable.
Trends are now visible.
Renewals are now evidence-based.
But the solution has not changed.
Discipline.
Monitoring is repetitive.
Calendar-driven.
System-based.
Factories that treat monitoring as routine rarely panic.
Factories that treat monitoring as last-minute activity always struggle.
Environmental monitoring is not about fear.
It is about control.
And control is built quietly, long before inspection day.
Frequently Asked Questions (Factory-Level Doubts) What if one monitoring result exceeds the limit once? Do not panic.
Immediately:
Recheck internal process data
Record:
Root cause
If trend returns to normal and documentation is clear, one exceedance is usually manageable.
Silence and no documentation create bigger issues than the exceedance itself.
Can I change monitoring lab mid-year? Yes.
But maintain documentation.
Ensure new lab is NABL accredited and understands your consent conditions.
Keep continuity in records.
Is internal lab testing enough? Internal testing is useful for process control.
But for legal compliance submission, third-party accredited lab is required.
Both have different purposes.
What if I miss one monitoring cycle? Do not ignore it.
Conduct monitoring at the earliest possible date.
Document the reason clearly:
Production shutdown
Repeated missed cycles indicate weak system.
One documented delay indicates transparency.
How long should monitoring records be preserved? Keep at least 3–5 years of monitoring reports safely.
Digital backup is strongly recommended.
If ambient air is high due to nearby road, will we be blamed? Not automatically.
Ambient reflects area condition.
But ensure your stack emissions are controlled.
Maintain wind direction data during sampling if possible.
Can rainwater dilute effluent sample? Yes.
Which is why flow and sampling timing should be properly recorded.
Without documentation, dilution may raise suspicion.