 List, Rules & Compliance Guide ehssaral.webp)
Orange Category Industries in India (2026): List, Rules & Compliance Guide
orange category examples orange category industries cpcb classification pollution index environmental compliance india industrial pollution control
Last updated:
|8 Jun 2026
Read time: 20 min read
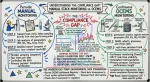
Why “Orange Category” Confuses Most Indian Factories
In many Indian plants, environmental compliance does not become difficult when limits are crossed.
It starts becoming difficult much earlier - at the stage of classification.
A unit starts operations assuming it is small, controlled, or not heavily polluting, and therefore should fall under Green category. A consultant may suggest Orange. During inspection, the Pollution Control Board may interpret the same process differently.
This is where confusion usually starts.
Two factories doing similar-looking work may still fall under different categories. A unit handling only mixing may be treated differently from one involving chemical reactions. A recycling unit using a dry process may remain in Orange, while a slightly modified process may move into Red.
From the plant’s perspective, this feels inconsistent.
From a regulatory perspective, it depends on how pollution potential is interpreted through actual process details.
Over the years, we have seen that most Orange category issues do not arise because industries are polluting heavily. They arise because:
- the process is not clearly understood during classification
- the category applied for does not match actual operations
- the systems expected for that category are not consistently operated
Before looking at lists or rules, one point needs to be understood clearly:
Orange category is not a safe middle zone. It is often the category where interpretation mistakes happen the most.
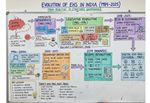
How CPCB Classifies Industries (Updated Understanding for 2026)
Industries in India are categorized based on their Pollution Index (PI), which reflects overall pollution potential by considering factors such as:
- air emissions
- effluent discharge
- hazardous waste generation
- resource consumption
Under the updated CPCB direction (Classification of Sectors into Red, Orange, Green, White and Blue Categories), the classification broadly follows:
| Category | Pollution Index (PI) | Meaning | Approx. No. of Sectors (CPCB ~2026) | Typical Industry Examples | Compliance Expectation |
|---|---|---|---|---|---|
| Red | ≥ 80 | High pollution potential | ~60 | Cement plants, bulk drugs & pharmaceuticals, large chemical manufacturing, thermal power plants, integrated steel plants | Strict control systems, continuous monitoring (OCEMS), high scrutiny, frequent inspections |
| Orange | 55 to < 80 | Moderate pollution potential | ~130+ | Dairy processing, paint blending, plastic recycling, textile dyeing, engineering units, food processing | Defined pollution control systems (ETP/APCD), regular monitoring, consistent operation expected |
| Green | 25 to < 55 | Lower pollution potential | ~150+ | Assembly units, small fabrication, packaging units, electronics assembly | Basic controls, limited monitoring, lower compliance burden |
| White | < 25 | Minimal pollution potential | ~60 | Solar panel assembly, LED assembly, biscuit making (dry process), small service units | No major pollution control systems required, minimal regulatory burden |
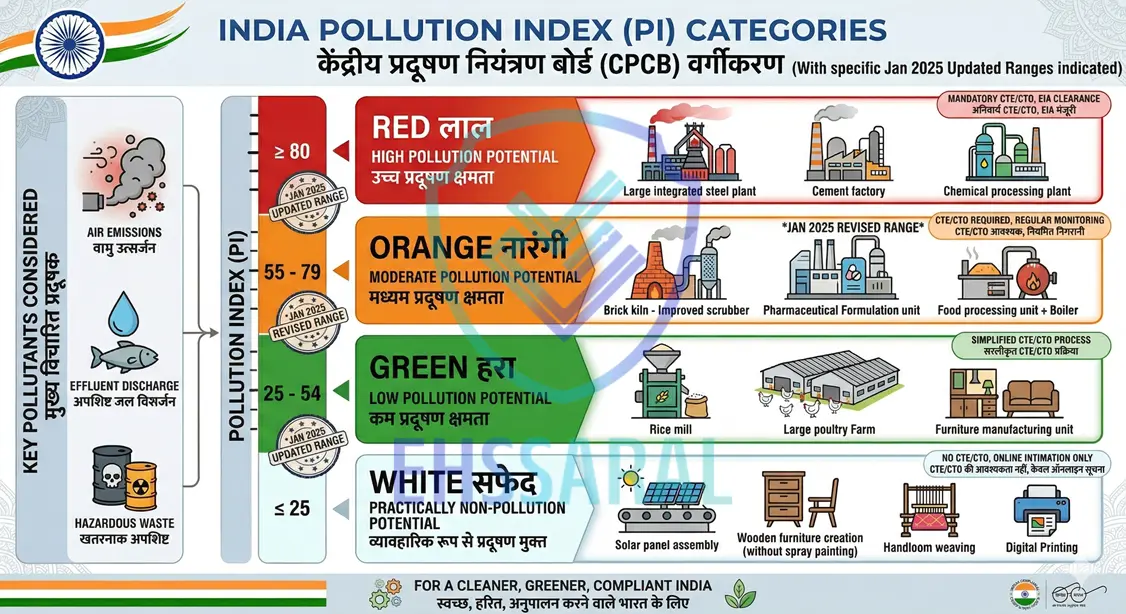
This classification is indicative and based on CPCB sector categorization. The exact category applicable to a unit depends on actual process details, raw materials, fuel type, and pollution control requirements, not just the industry name.
From a practical standpoint, factories do not calculate this index themselves. The category is assigned based on the industry type and process characteristics, not declared by the unit.
This is important.
A plant may feel that its emissions are low or operations are controlled. But if the process inherently carries a certain pollution potential, it will still fall under that category.
This is also why older content online often creates confusion. Many websites still show previous PI ranges, even though the classification approach has evolved.
In day-to-day operations, what matters is not the number alone. What matters is whether your actual process aligns with the category applied by CPCB and your respective SPCB such as MPCB or GPCB.
What Orange Category Industries Really Mean in Practice
On paper, Orange category represents moderate pollution potential.
In practice, it means something more specific.
An Orange category industry is expected to:
- Have defined pollution control systems in place
- Operate these systems consistently, not occasionally
- Maintain records and monitoring data
- Comply with consent conditions actively
Typically, an Orange category unit will require:
- Consent to Establish (CTE) before setting up
- Consent to Operate (CTO) before starting operations
- Pollution control infrastructure such as:
- Effluent Treatment Plant (ETP) or Sewage Treatment Plant (STP)
- Air Pollution Control Devices (APCDs) like scrubbers or filters
- Noise control for DG sets
What differentiates Orange from Green is not just pollution level, but expectation of control.
Orange category assumes that pollution exists-but is manageable with systems.
However, this is where ground reality often differs.
In many Indian factories, pollution control systems are:
- Installed correctly
- But not operated continuously
- Or operated only during inspection or sampling
This creates a gap between:
- Declared compliance
- Actual day-to-day operation
And this gap is where most observations, notices, and delays originate.
Indicative Examples of Orange Category Industries in India
While the exact classification should always be checked against the latest CPCB and respective SPCB list, the following types of industries commonly fall under Orange category in India:
- dairy processing units
- cashew nut processing units
- bakeries above defined production thresholds
- grain processing with wet operations
- paint blending and mixing units
- adhesive formulation units
- ink preparation units without chemical synthesis
- metal cutting and machining units
- fabrication units with moderate pollution load
- plastic recycling and reprocessing units
- PET bottle flake manufacturing units
- scrap processing units using dry process
- small textile dyeing and washing units
- sizing operations in textile processing
- engineering units generating oil-contaminated waste
- recycling units with controlled but continuous emissions or wastewater
This is not a substitute for the official sector list. It is an indicative understanding layer.
In practice, the exact category depends less on the industry name and more on:
- the actual process
- raw materials used
- fuel type
- pollution control systems required
- waste and effluent generated
Common Orange Category Industries (India – Practical View)
Instead of going through a long, unreadable list, it is easier to understand Orange category through typical industry groups seen in Indian industrial areas.
Food & Agro-Based Units
- Dairy processing units
- Cashew nut processing
- Bakeries (above certain scale)
- Grain processing with wet operations
These industries generate:
- Organic effluent (high BOD/COD)
- Wash water
- Solid organic waste
Even though they may appear “non-chemical,” the pollution load-especially in water-places them in Orange.
Chemical Handling (Without Complex Reactions)
- Paint blending and mixing
- Adhesive formulation
- Ink preparation (without synthesis)
Here, the classification depends heavily on what exactly is happening.
Simple mixing without reaction may fall under Orange. But the presence of:
- Solvent handling
- VOC emissions
- Additional chemical steps
can shift interpretation.
Engineering & Fabrication Units
- Metal cutting and machining
- Small fabrication workshops
- Re-rolling (depending on process)
These typically generate:
- Oil-contaminated waste
- Noise
- Minor air emissions
Individually, these may appear manageable-but combined impact leads to Orange classification.
Recycling & Reprocessing Units
- Plastic recycling
- PET bottle flake manufacturing
- Scrap processing (dry process)
This is one of the most misunderstood segments.
Two units both calling themselves “recycling” may fall into completely different categories depending on:
- Whether the process is dry or chemical
- Whether heating, melting, or treatment is involved
- Type of fuel used
Textile & Washing Operations
- Small-scale dyeing units
- Fabric washing and processing
- Sizing operations
These generate:
- Colored effluent
- Chemical residues
- Variable discharge loads
Even at smaller scales, the variability and load often push them into Orange.
One important observation from field experience:
Classification is rarely about the industry name.
It is about how the process actually runs on the shop floor.
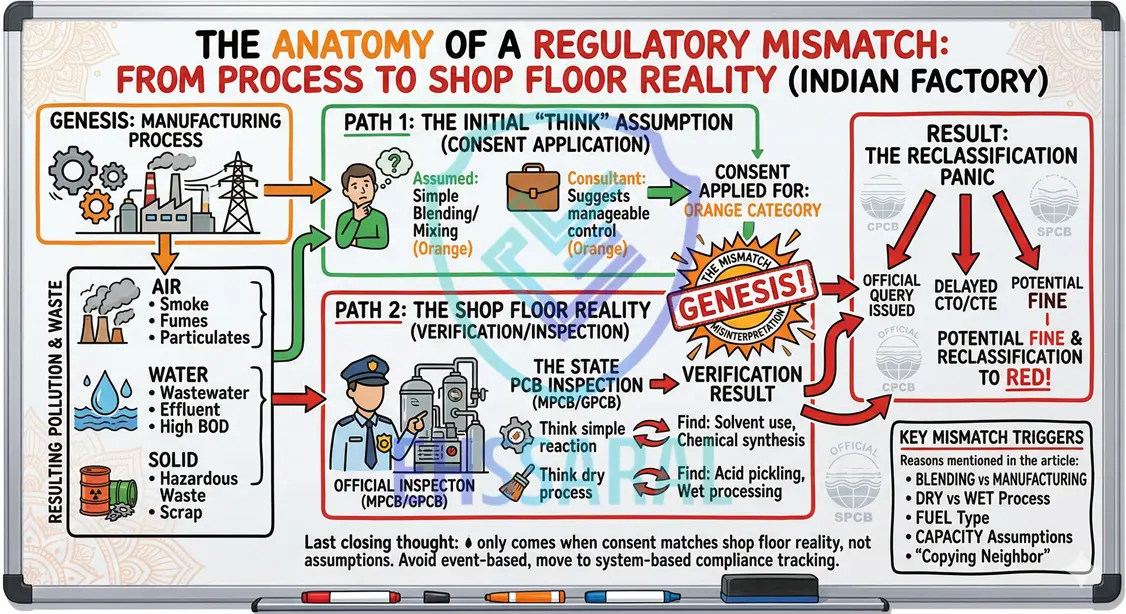
Where Orange Category Misclassification Usually Happens
This is the area where most confusion, delays, and compliance issues originate.
Not because the rules are always unclear - but because process boundaries are often misunderstood, simplified, or described too loosely during consent and compliance discussions.
1. Blending vs Manufacturing
This is one of the most common examples.
- Paint blending or mixing may remain in Orange
- Paint manufacturing involving chemical reactions may move towards Red
From the plant’s perspective, both may be casually described as “paint manufacturing.”
From a regulatory perspective, they are not the same.
The difference may depend on:
- whether any chemical reaction takes place
- whether solvent recovery or distillation is involved
- whether VOC emissions are significant
- whether the process remains simple formulation or becomes chemical manufacturing
This is where many classification mistakes begin.
If the process description is loose, the category becomes vulnerable to reinterpretation later.
2. Dry Process vs Wet/Chemical Process
Especially relevant in recycling and metal operations.
- Dry mechanical processing → often Orange
- Chemical treatment, acid use, or wet processing → may shift towards Red
For example:
- Scrap handling and cutting → lower pollution
- Acid pickling or chemical cleaning → significantly higher pollution potential
The classification changes-not because the industry name changed-but because process nature changed.
3. Fuel Type and Combustion Systems
Fuel plays a significant role in classification interpretation.
- Coal-fired systems → higher emissions
- Oil-fired systems → moderate
- PNG/LPG → relatively cleaner
Two identical units with the same process but different fuels may be evaluated differently.
However, one practical point:
Changing fuel does not automatically change category.
It needs to be reflected in consent and evaluated formally.
A cleaner fuel may improve your compliance position, but it does not automatically rewrite your category on paper.
4. Capacity-Based Assumptions
A very common misunderstanding.
Many plants assume:
- Smaller capacity → lower category
In reality, classification is often:
- Based on absolute thresholds, not relative scale
- Or based on process type irrespective of size
This leads to situations where:
- A small unit is still Orange
- A medium unit crosses into Red
5. “Copying” Classification from Nearby Units
This happens more often than expected.
A unit assumes:
- “Neighbor is Green, we are same”
But differences may exist in:
- Raw materials
- Process steps
- Fuel
- Waste generation
Even small differences can change classification.
6. Boundary Conditions Matter More Than Broad Labels
In many Orange category discussions, the biggest confusion comes from broad labels such as “food unit,” “recycling unit,” or “chemical unit.”
But classification usually depends on narrower boundary conditions such as:
- whether the process is dry or wet
- whether any chemical reaction is involved
- whether solvents, acids, or heavy metals are handled
- whether emissions are fugitive or controlled
- whether the unit remains within defined capacity thresholds
- whether fuel choice increases pollution load materially
This is why two units under the same broad industry label may still fall into different categories.
A Practical Way to Look at It
Most misclassification does not come from incorrect intention.
It comes from:
- Simplifying the process description
- Overlooking small but critical steps
- Assuming similarity without verification
And this usually becomes visible only when:
- Consent is reviewed
- Inspection happens
- Or data is evaluated in detail
- Environmental Inspection Checklist India
How Inspectors Actually Look at Orange Category Units
When a Pollution Control Board officer visits an Orange category unit, they are not just checking whether limits are within range.
They are trying to answer a deeper question:
Is this unit operating with a reliable compliance system, or is compliance being adjusted around inspections and sampling?
This is a critical shift in understanding.
What Inspectors Typically Observe
1. Process Understanding First, Not Equipment
Before looking at ETP or APCD, inspectors try to understand:
- What is the actual process flow?
- Where does pollution get generated?
- At which stage is control applied?
If the process explanation is unclear or inconsistent with consent conditions, it raises immediate concern.
2. System Presence vs System Operation
Many plants proudly show:
- Installed ETP
- Installed scrubber
- Monitoring records
But inspectors go one step further:
- Is the system running continuously?
- Are logs consistent over time?
- Do readings make sense with production levels?
For example:
- Zero discharge during full production → questionable
- Identical readings across days → suspicious
- Systems running only during sampling → visible patterns
If a system runs properly only when someone is coming to check it, that is not compliance. That is preparation.
3. Data Consistency (Increasingly Important in 2026)
With growing digital monitoring:
- OCEMS
- Online data submission
- Portal-based records
Inspectors are now correlating:
- Manual reports
- Online data
- Production activity
Mismatch between these is one of the biggest triggers for observations.
4. “Control Mindset” vs “Compliance Mindset”
This is subtle but important.
- Compliance mindset: “We meet limits during testing”
- Control mindset: “We manage pollution continuously”
Inspectors can usually tell the difference by:
- Asking operational questions
- Checking system familiarity of plant staff
- Observing how issues are handled
What Compliance Actually Means for Orange Category
From a document perspective, compliance looks straightforward:
- Valid Consent to Operate
- Monitoring reports within limits
- Proper records maintained
But on the ground, compliance is more layered.
1. Consent Conditions Are the Real Rulebook
Most plants underestimate this.
They focus on:
- Limits (mg/Nm³, mg/L)
But ignore:
- Operational conditions
- Monitoring frequency
- Reporting formats
- Specific instructions (like reuse, storage, disposal)
In reality:
Consent conditions define compliance more than limits alone.
2. Systems Must Match the Declared Process
If consent mentions:
- ETP → it must be operational
- Scrubber → it must be used consistently
- Fuel type → it must match actual usage
Any mismatch between:
- Declared system
- Actual practice
creates compliance gaps-even if limits are met occasionally.
3. Record Keeping Is Not Just Documentation
Records are often treated as paperwork.
But for inspectors, records are:
- A timeline of system behavior
- Evidence of consistency
Typical records expected:
- ETP logbook
- DG set log
- Hazardous waste records
- Monitoring reports
Gaps in records are often interpreted as:
- Gaps in operation
4. Monitoring Is Not a One-Time Activity
Many Orange category units still operate with this mindset:
- “Lab will come, we will ensure everything is fine that day”
This approach is increasingly risky.
Because:
- Patterns over time matter more than single reports
- Sudden “perfect results” stand out
ETP and Pollution Control: Where Reality Differs from Theory
- In many Orange category units, the problem is not that an ETP is absent. The problem is that it is present, but not operated with the consistency, load understanding, and discipline required for stable treatment.
This is one of the most critical sections-and where most practical issues exist.
Theoretical Expectation
An Orange category unit with effluent should have:
- Properly designed ETP
- Adequate capacity
- Continuous operation
- Treated discharge within limits
Ground Reality Observations
Across multiple industries, common patterns include:
1. ETP Installed, Not Optimized
- System exists
- But chemical dosing is inconsistent
- Sludge handling is irregular
- Operator understanding is limited
Result:
- Fluctuating output quality
2. Operation Depends on Monitoring Schedule
- System runs properly when sampling is expected
- Otherwise operated partially or intermittently
This creates:
- Good reports
- Poor overall control
3. Load Variation Not Managed
Many processes generate variable load:
- Peak production → high effluent
- Idle time → low effluent
But ETP operation remains constant, leading to:
- Under-treatment during peaks
- Overdosing during low load
4. Sludge and Waste Handling Ignored
ETP is not just treatment.
It also generates:
- Sludge
- Residual waste
Improper handling of this can itself become a compliance issue.
Industry-Wise Practical Differences (Important for Understanding Orange Category)
Food Processing Units
- High organic load
- Biological treatment required
- Odour issues if not managed
Common issue:
- Underestimating load during peak operations
Paint / Chemical Blending Units
- Solvent handling
- VOC emissions
- Hazardous waste
Common issue:
- Focusing on effluent but ignoring air emissions
Engineering Units
- Oil and grease contamination
- Metal waste
Common issue:
- No structured waste segregation
- Improper storage
Recycling Units
- Highly variable input material
- Emission inconsistency
Common issue:
- Process changes without updating consent
Practical Pollution Control Focus by Industry Type:
| Industry type | Typical pollution concern | Common control gap |
|---|---|---|
| Food processing | High BOD/COD, odour, wash water | Underestimating peak load in ETP |
| Paint / blending | VOC emissions, sludge, hazardous waste | Focusing only on effluent and ignoring air emissions |
| Engineering | Oil and grease, metal scrap, contaminated waste | Poor segregation and storage |
| Recycling | Variable emissions, fuel impact, process inconsistency | Process changes without consent update |
| Textile / washing | Colored effluent, fluctuating chemical load | Treating variable effluent like constant load |
2026 Shift: Why Orange Category Is Becoming More Sensitive
The shift in 2026 is not just about updated classification tables. It reflects a broader move toward clearer categorization, higher data visibility, and stronger logic-based evaluation of whether a plant’s systems actually match its declared category and compliance position.
Now, the landscape is changing.
1. Digital Monitoring Is Increasing
- Online systems
- Data visibility
- Pattern detection
This reduces dependency on:
- Physical inspection alone
2. Data Validation Is Becoming Stricter
Regulators are increasingly looking at:
- Consistency
- Gaps
- Abnormal patterns
Not just:
- Final reported values
Another reason for confusion is that many search results still reflect older categorization references. This is why EHS professionals often see different PI ranges online. In practice, the safer approach is to rely on the latest CPCB direction and then cross-check state-level application through the respective SPCB.
3. System-Based Evaluation Is Replacing Relationship-Based Approaches
Earlier:
- Consultant-driven compliance
- Relationship-based comfort
Now:
- System-driven evaluation
- Data-backed observations
A Simple Way to Understand Orange Category Today
Instead of thinking:
“We are not heavily polluting, so we are safe”
Think:
“We have pollution potential that must be continuously managed and demonstrated”
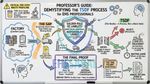
How to Check If Your Industry Is Correctly Classified
- A long official list may help identify your sector. But classification clarity usually comes faster when you ask the right process questions internally.
Forget long CPCB lists for a moment.
If you want clarity, ask these 5 questions about your plant:
1. What exactly is happening in your process?
Not what you call it.
Not what your consultant wrote.
What is actually happening on the shop floor?
- Is there any chemical reaction?
- Are you using solvents or acids?
- Is there heating, melting, or combustion?
- Is water being used and discharged?
Even a small overlooked step can change classification.
2. Where is pollution getting generated?
Break it into three:
- Air → fumes, dust, VOCs
- Water → effluent, wash water
- Solid/Hazardous waste
If all three exist-even at moderate levels-Orange is often justified.
3. What systems are required to control it?
If your process needs:
- ETP
- Scrubber
- Filters
- Hazardous waste storage
Then you are already in a category where active control is expected.
This is rarely Green.
4. Does your Consent match your actual process?
This is where many gaps exist.
Check:
- Raw materials listed
- Products mentioned
- Fuel type
- Installed systems
Mismatch example:
- Consent says PNG → plant uses furnace oil
- Consent shows no effluent → actual washing happening
Even if operations are controlled, this mismatch creates compliance risk.
5. If inspected today, would your system run normally?
This is the most honest test.
Ask yourself:
- Will ETP run as usual?
- Will records match operations?
- Will staff confidently explain systems?
If the answer depends on preparation, not routine-there is a gap.
A Simple Internal Classification Logic
Process → Pollution generation → Control system required → Monitoring need → Record expectation → Category sensitivity
The more your process depends on active pollution control and regular monitoring, the less likely it is to sit in a low-risk category.
A Simple Decision Lens (Use This Internally)
Instead of overthinking categories, use this practical lens:
If your plant needs continuous pollution control systems to remain compliant,
you are not in a “low-risk” category.And if those systems are not consistently operated:
You are exposed-regardless of what your last report says.
Real-Life Scenario (Common Across Industrial Areas)
Let’s take a typical situation.
A mid-sized unit:
- Does chemical blending
- Uses small quantities of solvents
- Generates limited effluent
They assume:
“We are small, so Orange is enough-or maybe even Green”
Consent obtained: Orange
Everything seems fine.
What actually happens later
- Production increases slightly
- Additional solvent used
- Small process modification introduced
But:
- Consent is not updated
- Systems remain same
- Monitoring is periodic
During inspection:
- Process appears more intensive than declared
- Emissions slightly higher
- Records not fully aligned
Now the issue is not just compliance.
It becomes:
“Is this unit correctly classified and operating as per consent?”
This is how a simple gap turns into:
- Query
- Delay
- Possible reclassification
- Additional compliance burden
Top Mistakes Orange Category Units Make
- These mistakes usually do not look serious in isolation. But over time, they create the exact pattern that leads to queries, delays, and avoidable compliance stress.
These are not theoretical. These are patterns seen repeatedly.
1. Treating Consent as a One-Time Approval
Many units:
- Obtain CTO
- File it away
But forget:
- Consent is a living document
- It must evolve with process
2. Focusing Only on Final Limits
Plants often track:
- Emission values
- Effluent values
But ignore:
- How those values are achieved
- Whether systems are stable
3. Running Systems Only When Needed
This is one of the biggest risks.
- ETP operated only during discharge
- Scrubber used selectively
- DG set noise controlled only during checks
This creates:
- Inconsistent data
- Pattern-based observations
4. Ignoring Small Process Changes
Even minor changes matter:
- New raw material
- Additional machine
- Change in fuel
If not reflected in consent:
It becomes a compliance gap.
5. Poor Record Culture
Common issues:
- Backdated entries
- Missing logs
- Inconsistent formats
For inspectors, this signals:
Lack of system discipline
A Practical Compliance Checklist (Keep This Simple)
If you want to stay in control, focus on these:
Process Alignment
- Consent matches actual process
- Raw materials updated
- Fuel type correctly declared
System Operation
- ETP running daily
- APCD operating during production
- Maintenance done regularly
Monitoring
- Periodic monitoring as per consent
- Internal checks (even basic)
- No sudden “perfect” data patterns
Records
- Daily logs maintained
- No gaps or overwriting
- Easy to explain
Waste Handling
- Hazardous waste properly stored
- Disposal through authorized vendors
- Records available
If these five are in place, most Orange category units stay stable.
What Has Changed in 2026 (And Why It Matters)
Earlier, a plant could operate with:
- Limited documentation
- Occasional monitoring
- Consultant-driven compliance
Now, the environment is shifting.
1. Systems Are Becoming More Visible
- Data is being recorded digitally
- Patterns can be tracked
- Gaps are easier to identify
2. Evaluation Is Becoming More Logical
Instead of:
“Report is within limit, so okay”
The thinking is shifting to:
“Does the system behave logically over time?”
3. Dependence on Individuals Is Reducing
Earlier:
- Compliance depended on:
- One EHS officer
- One consultant
Now:
- Systems are expected to hold continuity
The Bigger Shift You Should Understand
This is the most important takeaway.
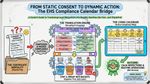
Compliance is moving from event-based to system-based.
Earlier:
- One good report = comfort
Now:
- Continuous system behavior = confidence
What Many Factories Realize Too Late
By the time a notice, query, or inspection observation reaches management, the actual system gap usually started much earlier.
It may have started when:
- a process changed but consent was not updated
- records became irregular
- pollution control systems were used inconsistently
- internal review stopped happening routinely
This is why Orange category compliance should not be seen only at the point of inspection. It should be seen as a system that is either stable every day, or slowly becoming unreliable.
How to Move from “We Think We Are Compliant” to “We Know We Are”
At this stage, the goal is not to add more documents or complexity.
The goal is to create clarity inside your own system.
Step 1: Make Your Consent Actionable
Most consents are:
- Long
- Text-heavy
- Difficult to track
But every consent actually contains:
- Tasks
- Frequencies
- Conditions
Instead of treating it as a document, convert it into:
A simple internal checklist of:
- What needs to be done
- When it needs to be done
- Who is responsible
Step 2: Link Process → Pollution → Control
For each major activity in your plant, map:
- What process step is happening
- What pollution it generates
- What system controls it
Example:
- Mixing → VOC → Scrubber
- Washing → Effluent → ETP
- DG operation → Noise + emission → Acoustic + stack
This mapping creates clarity.
Without this, compliance becomes guesswork.
Step 3: Make Systems Routine, Not Reactive
Ask one simple question:
“Is this system running because it should, or because someone is watching?”
- ETP should run as part of process
- APCD should run with production
- Logs should be filled daily-not before inspection
When systems become routine:
- Data becomes stable
- Stress reduces
Step 4: Create Basic Internal Visibility
You don’t need complex dashboards.
Even simple tracking helps:
- Consent expiry
- Monitoring schedule
- Waste disposal frequency
- System downtime
Most factories struggle not because they don’t do compliance-but because they lose track of it.
Step 5: Review Your System Like an Inspector Would
Once a month, step back and ask:
- Does our process match consent?
- Are our systems consistently running?
- Do our records tell a clear story?
This single habit can prevent most surprises.
Where Most Factories Eventually Want to Reach
After years of working with different types of units, one pattern is clear.
Factories don’t want:
- More rules
- More documentation
- More complexity
They want:
Peace of mind that nothing will suddenly go wrong
And that comes only when:
- You don’t depend on memory
- You don’t depend on timing
- You don’t depend on individuals
Instead, you have:
A system that shows you where you stand-at any point of time
Why This Is Becoming More Important Now
As compliance becomes more structured:
- Data is increasing
- Expectations are clearer
- Gaps are easier to identify
This creates two types of factories:
1. Reactive Factories
- Wait for:
- Lab reports
- Consultant updates
- Notices
Operate in:
- Uncertainty
- Last-minute correction
2. System-Driven Factories
- Know:
- Their obligations
- Their system status
- Their risks
Operate with:
- Stability
- Predictability
The gap between these two is not technology.
It is:
Visibility + discipline
Common Signs That Your Unit May Face Issues Soon
Even if everything looks fine today, watch for these signals:
- Systems not running daily
- Records updated in batches
- Process changes not reflected in consent
- Dependence on one person for compliance
- Last-minute preparation before monitoring
These are early indicators-not failures yet, but risks building up.
Final Perspective: What Orange Category Really Demands
If we simplify everything discussed:
Orange category is not about:
- High pollution
- Complex regulation
It is about:
Managing moderate pollution with consistent systems
Factories that struggle usually:
- Underestimate system discipline
- Overestimate occasional compliance
Factories that stay stable:
- Understand their process
- Run their systems regularly
Maintain clarity in records
Why More Factories Are Moving Toward System-Based Compliance Tracking
As environmental compliance becomes more structured, many factories are moving away from memory-based and event-based tracking.
They are trying to create visibility around:
- consent conditions
- upcoming monitoring
- waste disposal timelines
- system downtime
- recurring compliance tasks
This shift is important because most Orange category units do not fail due to lack of effort. They fail because obligations are scattered across documents, people, and dates.
When compliance becomes visible, it becomes manageable.
Closing Thought
Most compliance problems do not start when limits are crossed.
They start when:
- data does not make sense
- systems are not trusted
- processes are not clearly understood
If these three remain unclear, even a technically decent plant can start appearing unreliable during inspection or review.
That is why Orange category should not be seen as just a moderate pollution category.
It should be seen as a category that demands:
- process clarity
- system discipline
- record consistency
Factories that struggle usually underestimate this.
Factories that remain stable usually understand one thing early:
occasional compliance is not the same as controlled compliance.
If you look at your plant today and feel,
“We are managing, but not fully confident,”
that is not a bad place to start.That is usually the point where real improvement begins.
Because clarity does not come from more paperwork.
It comes from seeing your own system clearly - before someone else has to point out where it is failing.
Frequently Asked Questions
Can an Orange category industry become Green?
In some cases, yes-but only if:
- The process changes significantly
- Pollution potential reduces
- It is formally evaluated and approved
Changing category is not just an application-it is a process validation exercise.
Does smaller scale mean lower category?
Not always.
Category depends on:
- Process type
- Pollution potential
A small unit can still be Orange or even Red.
If my reports are within limits, am I safe?
Not completely.
Reports show:
- A point in time
Compliance requires:
- Consistency over time
- System stability
Can I operate without an ETP if effluent is minimal?
Only if:
- It is clearly justified
- Accepted in consent
Otherwise, absence of a required system becomes a compliance issue.
How often should I review my compliance?
At minimum:
- Monthly internal review
This helps catch:
- Gaps
- Delays
- Inconsistencies
before they become external observations.

Harshal T Gajare
Founder, EHSSaral
ISO 14001 Lead Auditor | Second-generation environmental professional simplifying EHS compliance for Indian manufacturers through practical, tech-enabled guidance.
Related Blogs
Manual Stack Monitoring vs OCEMS: Why Results Differ in Environmental Compliance
Environmental Inspection India: What Inspectors Check | EHSSaral
TSDF Process for Hazardous Waste: What Happens After Dispatch | EHSShala
Used Oil & Waste Oil Management in India - Factory & EHS Guide | EHSShala
Hazardous Waste Storage Rules in Indian Factories | EHSShala
Environmental Monitoring Guide for Indian Factories: Air, Water & Noise | EHSShala

EHSShala Start – Begin Your EHS Learning Journey in India
 ehssaral.webp)
Hazardous Waste Form 4 Portal Errors (MPCB & GPCB Fix Guide)