
EHSShala
Isokinetic Sampling Basics: Simple Guide for Stack Monitoring | EHSShala
EHSSaral is an Environmental Compliance Intelligence Platform for Industries. Consent Intelligence • Alerts & Tasks • Incident Reporting • Form IV & V • Audit-Ready Records
See how EHSSaral works
15 Sep 2026
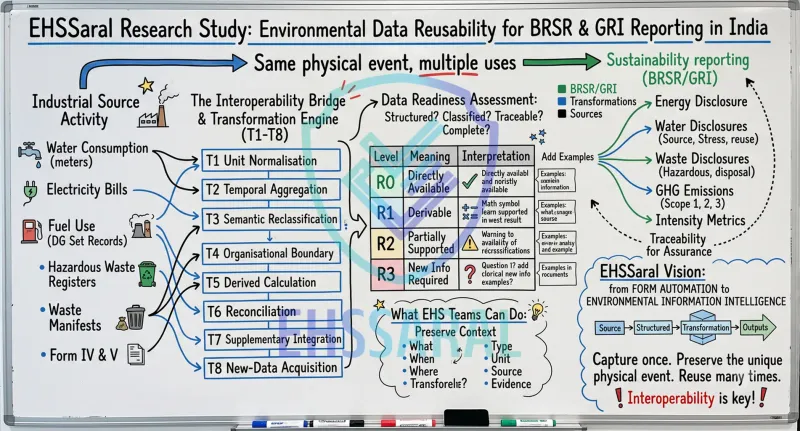
An EHSSaral Research Study on Environmental Source Data, Reporting Gaps and Data Reusability
Indian industries already collect a large amount of environmental data.
Water consumption is measured. Electricity bills are maintained. Fuel consumption is recorded. Hazardous waste is entered in registers. Waste movement is documented through manifests. Production quantities are tracked. Environmental monitoring is carried out. Form IV, Form V and other statutory records are prepared.
At the same time, companies are increasingly expected to report environmental information under frameworks such as the Business Responsibility and Sustainability Reporting (BRSR) framework and the Global Reporting Initiative (GRI) Standards.
This raises a simple but important question:
If companies already generate so much environmental data for compliance, can the same data be reused for sustainability reporting?
Our research suggests that the answer is:
Yes, to a significant extent — but usually not directly.
A significant part of the physical environmental data may already exist.
The bigger problem is often that this information is stored in different formats, for different reporting periods, under different classifications, or without all the context required for sustainability reporting.
The real challenge is therefore not only:
“Do we have the data?”
It is also:
“Is the data structured, classified, traceable and complete enough to be reused?”
This distinction is important for EHS teams, sustainability teams, consultants, auditors and companies developing environmental data systems.
Consider what actually happens inside an industrial facility.
Every day:
These are physical environmental events.
They happen before anyone prepares a Form V, hazardous-waste annual return, BRSR report, GRI disclosure or ESG dashboard.
However, the same environmental event may later be required for several different purposes.
For example:
Electricity meter or electricity bill
→ Internal energy record
→ Environmental statement
→ BRSR energy disclosure
→ GRI energy reporting
→ GHG Scope 2 calculation
Similarly:
Hazardous waste generation
→ Internal generation record
→ Form 3 record
→ Form 10 manifest
→ Annual hazardous-waste return
→ Form V
→ BRSR waste disclosure
→ GRI waste disclosure
The physical event is the same.
What changes is the reporting requirement.
This is why environmental data should increasingly be treated as a reusable information asset rather than information collected only for one statutory form or one annual submission.
EHSSaral's research used an exploratory multiple-case document-analysis approach.
The study had two main parts.
First, selected environmental requirements under BRSR and GRI were broken down into the actual information needed to answer them.
Second, those information requirements were compared with anonymised environmental records from nine facility-level cases across seven broad industrial and infrastructure contexts.
The cases included:
The records were reviewed at three levels.
Examples included:
Examples included:
Examples included:
The analysis focused mainly on four environmental areas:
Each sustainability information requirement was then classified using the R0–R3 reusability framework and the T1–T8 transformation framework explained later in this article.
The sample was purposive.
This means the study was designed to identify recurring environmental-data patterns and practical information gaps. It was not designed to statistically represent all Indian industries.
The research also did not assess whether any individual organisation was compliant or non-compliant.
The central question was:
Can environmental information already generated through compliance and normal operations support BRSR and GRI environmental reporting?
There is already considerable discussion around how BRSR compares with GRI.
Typical questions include:
These comparisons are useful.
But they do not completely answer the operational question.
Suppose BRSR and GRI both require information about water.
That does not automatically mean that a factory's existing water records are ready to satisfy both requirements.
The more practical question is:
Can the actual meter reading, invoice, register, manifest, laboratory result or operational record be transformed into the required disclosure?
Our research therefore shifts the discussion from:
Framework-to-framework comparison
to:
Source-data-to-disclosure comparison
This distinction may appear small, but operationally it changes the problem significantly.
To understand how useful existing compliance data can be for sustainability reporting, we classified environmental information into four practical levels.
| Level | Meaning | Practical Interpretation |
|---|---|---|
| R0 – Directly Available | Required information already exists in usable form | Can potentially be reported with little transformation |
| R1 – Deterministically Derivable | Required information can be calculated from existing records | Data exists, but a defined calculation or conversion is required |
| R2 – Partially Supported | Existing records provide only part of the required information | Additional classification, context or supporting data is required |
| R3 – New Information Normally Required | Existing compliance records do not normally provide the required information | A new data point or data-capture process is needed |
These four levels help separate very different types of data problems.
Environmental Compliance to Sustainability Framework India
Suppose an electricity bill clearly records:
Electricity consumed: 125,000 kWh
for exactly the required reporting period.
If the sustainability disclosure requires electricity consumption for the same period and organisational boundary, the basic information may already be directly available.
Similarly, a properly maintained hazardous-waste record may already contain:
In such cases, the company may already possess the basic environmental number required.
However, even R0 information should not automatically be copied into a sustainability report without checking:
Sometimes the source information exists, but the final reporting value does not.
For example:
| Month | Electricity Consumption |
|---|---|
| April | 100,000 kWh |
| May | 110,000 kWh |
| June | 105,000 kWh |
If annual electricity consumption is required, the organisation does not need to collect a completely new data point.
It can calculate it from existing monthly records.
Similarly:
The information is therefore not missing.
It needs transformation.
This may be one of the most common situations.
Suppose existing water records show:
Total water consumption: 50,000 KL
This is useful.
But sustainability reporting may require additional information such as:
The existing compliance record therefore supports part of the sustainability requirement, but does not completely satisfy it.
This is partial support.
The organisation does not necessarily need to start from zero.
It needs to identify what is missing around the existing number.
Some sustainability requirements need information that may simply not exist in traditional environmental compliance records.
A reporting framework may require a specific classification, methodology, contextual parameter or organisational information that the company has never captured.
In this situation, rearranging an existing Excel sheet will not create the missing information.
A new data field or data-collection process must normally be introduced.
This distinction is important.
An R1 problem may require calculation.
An R2 problem may require enrichment.
An R3 problem may require entirely new data collection.
These are very different problems and should not be treated in the same way.
One of the strongest observations from the study was that substantial physical environmental activity data already exists inside routine compliance and operational systems.
Strong data availability was observed particularly around:
This is important.
It suggests that organisations preparing sustainability reports may not always need to create an entirely separate environmental-data collection system from scratch.
However, there was an equally important second finding:
Data availability does not automatically mean reporting readiness.
The study found recurring gaps relating to:
This is where environmental compliance data and sustainability reporting begin to separate.
The study did not find one single reusability pattern across all environmental data.
Instead, different types of information commonly appeared at different levels.
| Reusability Level | Patterns Observed in the Research |
|---|---|
| R0 – Directly Available | Selected hazardous-waste totals, waste-storage values, selected destination information and some annual statutory environmental quantities |
| R1 – Deterministically Derivable | Monthly electricity to annual electricity, monthly fuel to annual fuel, daily or monthly water to annual water, existing activity data supporting selected GHG calculations and transaction-level waste to annual waste totals |
| R2 – Partially Supported | Water by source, treatment destination, renewable/non-renewable energy classification, waste recovery classification, environmental intensity and consolidated organisational reporting |
| R3 – New Information Normally Required | Water-stress information, external emission factors, many Scope 3 requirements and certain contextual sustainability information |
This shows an important point:
Environmental data reusability is not all-or-nothing.
Some information can be reused directly.
Some can be calculated from existing records.
Some needs additional context.
And some must be collected separately.
That is why a company should first understand what type of data gap it has before creating another reporting template.
This research supports a principle we are using while developing EHSSaral:
Environmental compliance software should not only generate statutory outputs. It should preserve the source-level environmental information, evidence and context underneath those outputs.
For example, software may help prepare a hazardous-waste annual return.
But the stronger environmental-data system is the one that also preserves:
The statutory form then becomes one output from a structured environmental-data trail.
The same principle can apply to water, energy, Form V and other environmental information.
EHSSaral is being developed around environmental compliance first, but with the idea that well-structured compliance data should remain useful beyond the immediate statutory submission.
Our research identified eight recurring types of transformation between environmental source records and sustainability reporting.
| Code | Transformation | Simple Meaning |
|---|---|---|
| T1 | Unit normalisation | Convert data into consistent units |
| T2 | Temporal aggregation | Combine daily, monthly or transaction-level data into the required reporting period |
| T3 | Semantic reclassification | Reclassify existing information according to the reporting framework |
| T4 | Organisational-boundary transformation | Match facility-level data with the reporting organisation's boundary |
| T5 | Derived calculation | Calculate a reporting value from existing activity data |
| T6 | Reconciliation | Compare multiple records and identify inconsistencies |
| T7 | Supplementary operational-data integration | Combine environmental data with information from other departments or systems |
| T8 | New-data acquisition | Capture information that does not currently exist |
These transformations help explain what actually happens between collecting environmental data and reporting it.
Environmental information often exists in different units.
For example:
Water
Fuel
Waste
One register may record waste in kilograms while another report requires metric tonnes.
This may appear to be a small issue.
But uncontrolled unit conversions can create significant reporting errors.
A structured environmental data system should preserve the original quantity and original unit, while also allowing controlled conversion where required.
Environmental compliance and operations generate information at different frequencies.
A facility may record:
Water
Daily
Electricity
Monthly
Hazardous waste
Transaction-wise
Environmental monitoring
Monthly or quarterly
Sustainability reporting may require:
Annual values
The challenge therefore becomes:
How do we convert thousands of source-level environmental events into one annual figure without losing traceability?
Ideally, an annual value should still be traceable back to its:
Semantic reclassification is more complex than unit conversion.
Two systems may describe the same physical activity differently.
For example, hazardous waste may be classified according to a statutory waste category for environmental compliance.
But sustainability reporting may require classification based on:
The physical quantity may already exist.
What changes is its meaning within the reporting framework.
That is semantic transformation.
Environmental compliance records are usually maintained at the facility level.
Corporate sustainability reporting may cover:
A factory may know exactly how much electricity it consumed.
The sustainability team must still determine whether that factory falls within the reporting boundary and how its data should be consolidated.
Therefore, even accurate facility-level environmental information does not automatically become corporate sustainability information.
Some sustainability indicators do not physically exist anywhere.
They have to be calculated.
Consider greenhouse-gas emissions.
A diesel register may show:
Diesel consumed = X litres
But it does not directly show:
GHG emissions = X tCO₂e
That requires a calculation such as:
Activity data × appropriate emission factor
Similarly, an environmental intensity indicator may require:
Environmental quantity ÷ appropriate denominator
The underlying information may exist.
The final sustainability indicator has to be derived.
Reconciliation may be one of the most important transformations for environmental-data credibility.
Consider hazardous waste.
A facility may have:
These records should tell one consistent story.
A basic relationship may be:
Opening stock + Generation – Quantity dispatched = Closing stock
But actual records may contain differences.
In such situations, sustainability reporting should not simply use whichever annual figure is easiest to find.
The underlying records should first be reconciled.
This is also where environmental compliance documentation can become valuable supporting evidence.
Environmental records alone may not always be sufficient.
For example, an intensity calculation may require:
This information may come from:
Environmental sustainability reporting therefore becomes a cross-functional data problem.
Finally, some information must simply be captured for the first time.
Organisations should identify these gaps early.
If the sustainability team discovers near the end of the financial year that a particular field should have been captured from the beginning of the year, reconstructing that information may become difficult.
This is one reason environmental-data planning should happen before the reporting period ends, not only when the annual sustainability report is being prepared.
A major conclusion from this research is:
Compliance-ready data is not automatically sustainability-ready data.
Consider hazardous waste.
A statutory requirement may primarily need information about:
How much hazardous waste was generated?
A sustainability framework may need additional information about:
The compliance number is still valuable.
But it may represent only one part of the sustainability information requirement.
India's Environmental Statement in Form V is particularly interesting from a sustainability-data perspective.
Form V can contain information relating to areas such as:
This makes Form V conceptually closer to sustainability reporting than many organisations realise.
However:
Form V should not be treated as a replacement for BRSR or GRI.
A better way to understand it is:
Form V can provide part of the underlying environmental evidence base that may support sustainability reporting.
The same principle applies to many other environmental compliance records.
Hazardous-waste documentation provides another useful example.
A properly maintained hazardous-waste system may contain information through several records.
Generation
→ Internal generation record / Form 3
Movement
→ Form 10 manifest
Receipt or disposal
→ Recycler, co-processor or TSDF evidence
Annual consolidation
→ Hazardous-waste annual return
Environmental statement
→ Form V
Together, these records create an environmental data trail.
That trail may later support sustainability disclosures relating to:
The important word is:
Collectively
Looking only at one annual summary can remove valuable context contained in the underlying transactional records.
Another important finding from our research was that organisations preserve environmental information at different levels.
In some cases, the underlying source records were available.
For example:
Daily readings → Monthly records → Annual return
In other cases, environmental information was mainly available through a final annual form or summary.
This creates an important distinction between:
Theoretical regulatory availability
and:
Operational source-data availability
A regulation may require an organisation to maintain certain environmental records.
But that does not automatically mean those records are:
The information may technically exist while still being operationally difficult to use.
Consider a manufacturing facility that maintains:
For environmental compliance, the organisation may primarily want to know:
How much water was consumed?
For sustainability reporting, additional questions may arise:
The physical environmental activity remains the same.
The information requirement changes.
The solution is therefore not necessarily another annual Excel sheet.
A better approach is to preserve enough source-level context when the environmental data is first captured.
Consider diesel consumption.
A company may maintain the following operational record:
| Date | Equipment | Fuel | Quantity |
|---|---|---|---|
| 10 April | DG Set | HSD | 500 L |
| 15 April | DG Set | HSD | 450 L |
| 25 April | DG Set | HSD | 600 L |
For environmental or operational purposes, this record may be sufficient.
For energy reporting, the organisation may additionally need:
For GHG reporting, the organisation may also require:
The diesel quantity itself is highly reusable.
But the final GHG disclosure requires another information layer.
Consider the following example:
Opening hazardous-waste stock: 200 kg
Waste generated during the year: 2,500 kg
Waste dispatched: 2,400 kg
Expected closing stock:
200 + 2,500 – 2,400 = 300 kg
Now suppose the physical record or annual return shows:
Closing stock: 450 kg
There is a difference of 150 kg.
Possible reasons may include:
This is why sustainability-data quality cannot be created only during final reporting.
It begins much earlier with the quality of source records.
A useful principle for environmental information management is:
Capture once. Preserve the context. Reuse many times.
Consider one water-meter reading.
The same reading may eventually support:
Similarly, one hazardous-waste dispatch transaction may support:
But this level of reuse is only possible when enough context is preserved with the original information.
A useful environmental record should ideally answer several questions.
Example:
2.5 MT of hazardous waste generated
Record the:
Record the:
Examples include:
Examples include:
Examples include:
Depending on the environmental activity:
Examples include:
This is very different from storing only:
Annual waste generated = 25.3 MT
The annual figure may be correct.
But much of its environmental context has disappeared.
Excel itself is not the problem.
Excel is flexible, familiar and extremely useful.
The difficulty starts when environmental information becomes distributed across:
A company may have:
EHS Excel
Production Excel
Electricity data with finance
Fuel purchase records
Form V
Hazardous-waste register
Form 10 manifest folder
Laboratory monitoring reports
ESG consultant template
Each individual file may be correct.
The problem appears when somebody needs to connect all of them.
That is an interoperability problem.
Digitising environmental records is useful.
But digitisation alone does not guarantee that the same information can be reused across different reporting systems.
If the same water, waste or fuel information has to be manually entered again into:
the data may be digital but it is still fragmented.
Better interoperability looks more like:
Source Record
↓
Structured Environmental Data
↓
Validation and Reconciliation
↓
Required Transformation
↓
Compliance and Sustainability Outputs
The goal is not simply to convert paper into software.
Environmental compliance and sustainability reporting are often managed separately.
But at the data level, they may depend on many of the same underlying environmental events.
A practical information flow can be understood as four layers.
The objective is not to make every framework identical.
It is to avoid recreating the same environmental fact separately for every reporting requirement.
The same environmental-data problem looks different depending on who is working with it.
| Stakeholder | Practical Action |
|---|---|
| EHS Team | Preserve source, unit, date, facility, classification and supporting evidence instead of retaining only annual totals |
| Sustainability / ESG Team | Check whether each required data point is R0, R1, R2 or R3 before asking facilities to collect new information |
| Environmental or ESG Consultant | Trace final reported indicators backwards to source records, statutory returns, manifests and operational evidence |
| Management | Reduce duplicate data collection by treating environmental information as a common data foundation rather than separate compliance and ESG exercises |
| Assurance / Review Team | Check whether reported values can be reconstructed from source records, calculations and supporting evidence |
The main idea is simple:
Do not start with another template if the underlying environmental data may already exist somewhere in the organisation.
Start by understanding:
It is equally important to explain what our research does not conclude.
The study does not claim that:
The research makes a narrower argument:
A meaningful part of the environmental activity data required for sustainability reporting may already exist within compliance and operational processes. However, transformation, reconciliation, context and additional information are frequently required before that data becomes reporting-ready.
When companies struggle with BRSR, GRI or ESG reporting, the immediate conclusion is often:
“We don't have environmental data.”
Sometimes that is true.
But our research suggests another common situation:
The data exists, but it is not yet reporting-ready.
It may be:
This means the compliance-to-sustainability challenge is often an:
Interoperability, transformation and context-preservation problem.
Before beginning the next sustainability-reporting cycle, organisations can review the following areas.
Do we know:
Do we know:
Do we have:
Do we know:
If the answer is only:
“We have one annual number.”
the organisation may have a summary figure, but it may not necessarily be evidence-ready.
Environmental disclosures may increasingly be reviewed, assessed or assured.
A reviewer may not stop after seeing:
Total water consumption = 100,000 KL
The next questions may be:
The deeper the review goes, the closer the organisation moves back toward the source records.
That is why source-data preservation matters.
A mature environmental information system should ideally allow a reported figure to be traced backwards.
For example:
BRSR Environmental Indicator
↓
Calculation or Aggregation
↓
Facility Environmental Record
↓
Transaction, Meter or Operational Record
↓
Supporting Evidence
This is an environmental data trail.
The same relationship should also work in the opposite direction.
For example:
Form 10 Manifest
↓
Waste movement record
↓
Annual waste summary
↓
Hazardous-waste annual return
↓
BRSR or GRI waste reporting
The better these relationships are maintained, the less annual reporting depends on memory and manual reconstruction.
This research has influenced the way we think about environmental compliance software.
Traditional environmental digitisation often starts with a question such as:
Can software generate this statutory form?
That is useful.
But a stronger question is:
Can the system preserve, validate and trace the information that generates the form?
Consider hazardous waste.
Instead of storing only the final annual return, the environmental-data system can preserve the relationship between:
Opening stock
Generation
–
Dispatch
=
Expected closing stock
The same data trail can also connect:
The annual return then becomes an output of the underlying environmental-data system, rather than the complete data system itself.
The same principle can apply to:
At EHSSaral, this research supports a simple product direction:
Capture environmental information once, preserve its context, reconcile it where required, and make it reusable for multiple legitimate environmental reporting needs.
This does not mean that one software system can automatically generate every ESG or sustainability disclosure.
Different reporting frameworks still require different definitions, boundaries, calculations and judgement.
But a strong environmental-data foundation can reduce repeated data collection and make later reporting more traceable.
For us, that is the difference between form automation and environmental compliance intelligence.
Indian organisations already generate a considerable amount of environmental information through compliance requirements and routine operations.
Water, electricity, fuel, waste, production, raw materials and environmental-monitoring information may already exist in different forms across the organisation.
But the journey from:
Environmental Compliance Data
to:
Sustainability Reporting Data
is rarely simple copy and paste.
Environmental information may require:
Normalisation
→ Aggregation
→ Reclassification
→ Boundary Adjustment
→ Calculation
→ Reconciliation
→ Integration
→ New Data Collection
The bigger opportunity may therefore not be to create another reporting spreadsheet.
It is to improve the environmental data layer underneath all these reports.
Because ultimately:
The same litre of water, unit of electricity, litre of diesel or kilogram of waste should not have to become a different piece of data every time somebody asks a different reporting question.
The physical environmental event happened only once.
Our information systems should be capable of remembering it properly.
This article is based on an exploratory EHSSaral research study examining the relationship between environmental compliance records and BRSR and GRI environmental data requirements.
The underlying research analysed anonymised environmental records from nine facility-level cases across seven broad industrial and infrastructure contexts.
The analysis focused particularly on environmental information relating to:
The study evaluates environmental information reusability.
It does not assess the legal compliance, ESG performance or environmental performance of any individual organisation.
All organisational information considered in the research was anonymised.

Founder, EHSSaral
Founder - EHSSaral | Partner - Perfect Pollucon | ISO 14001 Lead Auditor | GHG Protocol Scope 2 | Chemist | Data Scientist | Second-generation environmental professional simplifying EHS compliance for Indian industries through practical, automated, tech-enabled, data driven compliance workflows.
Isokinetic Sampling Basics: Simple Guide for Stack Monitoring | EHSShala
SWM Rules 2026: Is Your Factory a Bulk Waste Generator? | EHSSaral

GRAP Stage IV Explained: What AQI 450+ Means for NCR Factories | EHSSaral
Form V Late Filing Penalty: Steps After 30 September
Form 10 Manifest System Explained: 7 Copies, Flow & SPCB Inspectors Checklist | EHSShala
The ZLD Mass Balance Trap: How Auditors Calculate Effluent Using Your Water Bills | EHSSaral
Hazardous Waste Management Software India | EHSSaral

Why Good People Still Struggle With Compliance in Indian SMEs | EHSSaral Research
ETP & STP Troubleshooting: The Complete Indian Guide | EHSShala
Consent to Establish (CTE) Explained: Process, Documents, Rules & Common Mistakes | EHSShala