
EHSShala
Hazardous Waste Rules & Management Explained | EHSShala
EHSSaral is an Environmental Compliance Intelligence Platform for Industries. Consent Intelligence • Alerts & Tasks • Incident Reporting • Form IV & V • Audit-Ready Records
See how EHSSaral works
15 Sep 2026
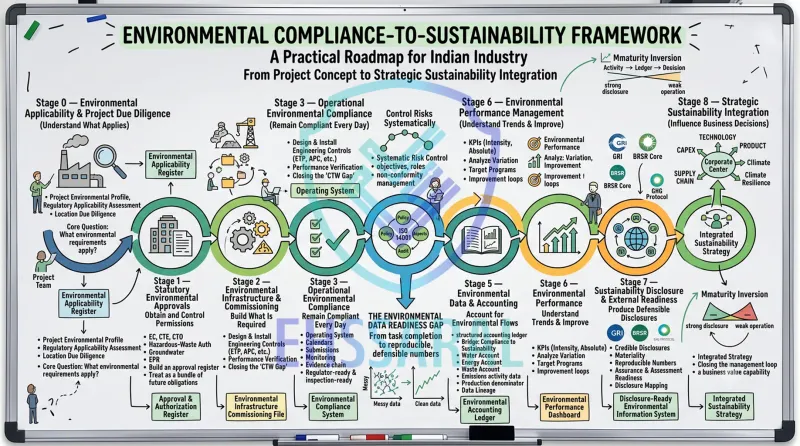
A practical roadmap from project planning and SPCB compliance to environmental data readiness, BRSR/GRI reporting and strategic sustainability
How does an Indian factory move from environmental approvals and SPCB compliance to reliable environmental data, BRSR, GRI and sustainability? This 9-stage framework helps organisations identify where they stand, what is missing and what capability they should build next.
Indian companies often build environmental capability in separate pieces.
The project team obtains approvals.
The plant installs the ETP, stack and waste-storage area.
The EHS team manages consent conditions, monitoring, hazardous waste and inspections.
Finance holds electricity and fuel invoices.
Production holds output data.
Stores holds material and waste movement records.
Years later, a sustainability or ESG team asks:
Then the annual scramble begins.
Files are collected.
Different departments provide different numbers.
Units do not match.
Waste generation does not reconcile with disposal.
Purchases are treated as consumption.
Missing months are estimated.
Evidence is difficult to trace.
The sustainability report may eventually get completed, but the underlying environmental information system remains weak.
This framework proposes a different approach.
Environmental sustainability should be built from the factory floor upward.
The organisation should progressively develop nine capabilities:
Applicability → Approvals → Infrastructure → Compliance → Management → Data & Accounting → Performance → Disclosure → Strategy
In simple language:
Understand → Get Permission → Build → Comply → Control → Account → Improve → Report → Integrate
The central principle of the framework is:
Do not start with the sustainability report. Start with the environmental activity that creates the number.
A water disclosure starts with a meter.
A waste disclosure starts with actual generation and movement.
A greenhouse-gas number starts with fuel, electricity or other activity data.
A credible environmental claim should ultimately be traceable to something that actually happened inside the organisation.
Environmental Compliance in India: Beginner Roadmap by EHSShala
This section is designed for a founder, plant head, EHS head or sustainability leader who wants a quick answer to three questions:
The detailed reference framework begins in Part II.
| Stage | Capability | Main Question | Main Output |
|---|---|---|---|
| 0 | Environmental Applicability | What environmental requirements apply to this project? | Environmental Applicability Register |
| 1 | Statutory Approvals | What permissions must we obtain and maintain? | Approval & Authorization Register |
| 2 | Environmental Infrastructure | Have we physically built the required environmental controls? | Commissioned Environmental Infrastructure |
| 3 | Operational Compliance | Can we remain compliant every day and prove it? | Environmental Compliance Operating System |
| 4 | Environmental Management | Are environmental risks systematically managed? | Environmental Management System |
| 5 | Environmental Data & Accounting | Can we reliably account for what physically happened? | Environmental Accounting Ledger |
| 6 | Environmental Performance | Can we explain trends and improve performance? | KPI & Improvement System |
| 7 | Sustainability Disclosure | Can our environmental numbers withstand external scrutiny? | Disclosure-Ready Dataset |
| 8 | Strategic Sustainability | Does environmental information influence business decisions? | Integrated Sustainability Strategy |
A new factory should not try to implement all nine stages at the same time.
The sequence matters.
Focus on:
Stage 0 - Environmental Applicability
Understand:
Do this before the project becomes difficult or expensive to change.
Focus on:
Stage 1 - Statutory Approvals
Determine and obtain the approvals required at the appropriate stage.
At the same time begin:
Stage 2 - Environmental Infrastructure Planning
Translate approval conditions into:
Complete Stage 2.
Do not commission only the production machinery.
Commission the environmental systems as well.
At the same time prepare:
Stage 3 - Operational Compliance
Build:
Stabilise:
Stage 3 - Operational Compliance
Then progressively establish:
Stage 4 - Environmental Management
At the same time, start collecting structured Stage 5 data immediately.
Do not wait until someone asks for a sustainability report.
Build:
Stage 5 - Environmental Data & Accounting
At minimum establish reliable:
Then begin:
Stage 6 - Environmental Performance
Calculate trends, intensity metrics and improvement opportunities.
Move into:
Stage 7 - Sustainability Disclosure Readiness
Map controlled environmental data into:
Move toward:
Stage 8 - Strategic Sustainability
Environmental information begins influencing:
An existing factory should not automatically start at Stage 0.
Instead, perform a gap assessment.
Ask these nine questions.
Do we know all environmental requirements that currently apply to our actual operations?
Are all approvals current and aligned with actual capacity, products, fuel, waste and processes?
Are all required environmental-control systems actually installed, adequate and working?
Can we demonstrate continuous compliance with conditions, monitoring, returns, waste records and evidence?
Do we systematically manage environmental risks, internal audits, corrective actions and improvement?
Can we reconcile water, energy, fuel, waste and production data and trace important numbers to evidence?
Can we explain year-on-year and month-on-month performance changes?
Can our externally reported environmental numbers be independently reproduced?
Does management use environmental information while making business decisions?
Your most important weak capability is usually where the next improvement programme should begin.
A company can have:
and still not be sustainability-data ready.
It may still struggle to answer:
This is the:
The Environmental Data Readiness Gap is the gap between an organisation's ability to demonstrate environmental compliance and its ability to produce complete, reconciled, traceable and reproducible environmental information.
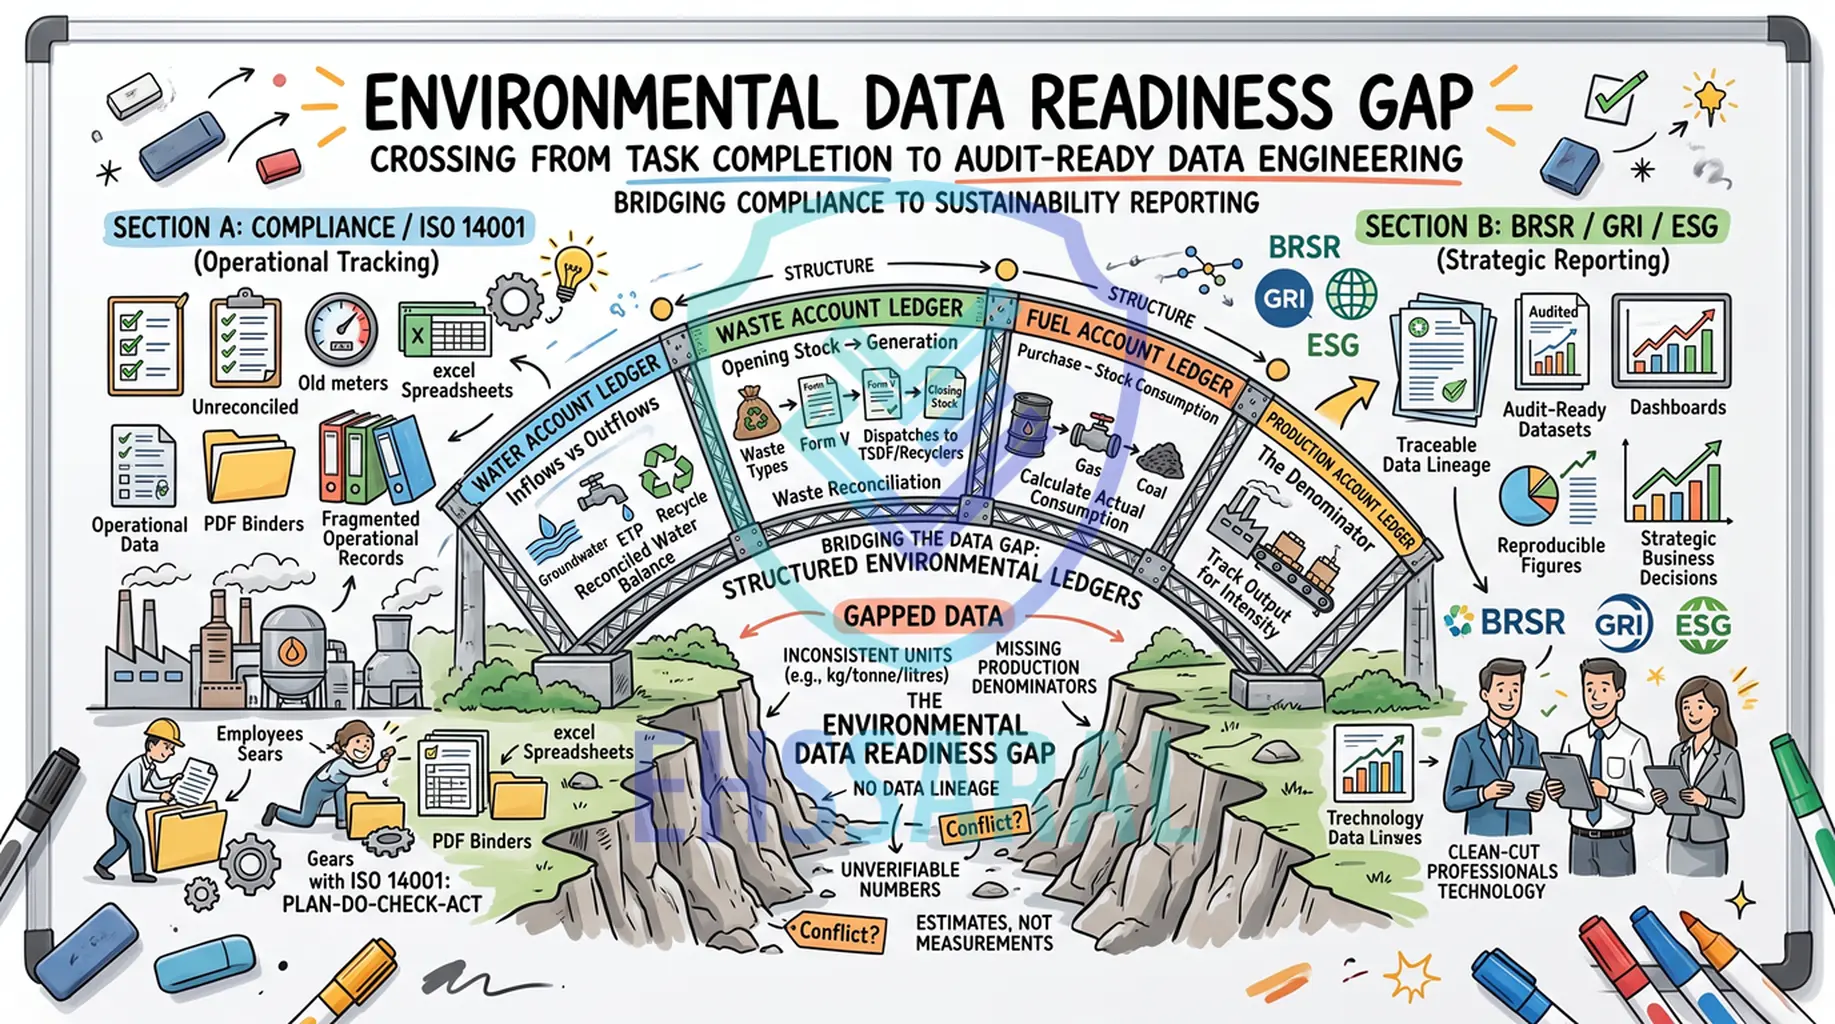
Stage 5 is where the organisation crosses this gap.
For many companies, this is the most difficult transition in the entire framework.
A company should not simply be called:
Level 4
or:
Stage 6.
Real organisations develop unevenly.
A better diagnostic uses four maturity dimensions.
Can the organisation:
Can the organisation:
Can the organisation:
Does environmental information influence:
| Score | Meaning |
|---|---|
| 1 - Reactive | Activities happen mainly after problems, deadlines or inspections |
| 2 - Basic | Some systems exist but depend heavily on individuals and manual follow-up |
| 3 - Controlled | Defined processes, responsibilities and records exist |
| 4 - Integrated | Systems are consistent, traceable, reviewed and connected across departments |
| 5 - Strategic | Information is reliable, automated where useful, predictive and used for decisions |
Imagine a company scores:
| Dimension | Score |
|---|---|
| Compliance | 4.5 |
| Data | 2.0 |
| Performance | 2.5 |
| Strategic | 3.0 |
This organisation may:
but still have:
Calling this company simply “mature” or “immature” tells management very little.
The real diagnosis is:
Strong compliance maturity, weak environmental data maturity.
That immediately indicates where improvement should begin.
Another common pattern is the opposite.
A company may publicly have:
while internally it still has:
Environmental Maturity Inversion occurs when visible sustainability ambition develops faster than the underlying environmental compliance, operational or data capability needed to support it.
The problem is not having ambitious sustainability initiatives.
The problem is building them on weak environmental foundations.
If several of these are true, your organisation may not primarily have an ESG-reporting problem.
It may have a Stage 5 environmental-data problem.
These five questions cover much of the framework.
Environmental Compliance Data for BRSR & GRI Reporting in India | EHSSaral Research
Understand the environmental consequences of the proposed or existing operation before relying on individual approvals or consultants.
The basic question is:
What environmental requirements apply to what we are actually doing?
Start with the physical reality of the project.
Document:
Products
What will be manufactured?
Capacity
What is the proposed annual or daily capacity?
Process
What operations occur between raw material and final product?
Raw materials and chemicals
Which chemicals, solvents, oils, additives or hazardous substances are used?
Utilities
What will be required for boilers, DG sets, cooling, compressed air, steam, refrigeration and other utilities?
Water
Estimate total requirement, source, process use, domestic use, cooling, boiler use and other uses.
Wastewater
Estimate quantity, sources, characteristics, treatment requirements and final destination.
Air emissions
Identify boilers, furnaces, reactors, process vents, DG sets, material handling and other emission sources.
Waste
Identify hazardous waste, used oil, waste oil, process residue, sludge, scrap, packaging, recyclables and non-hazardous waste.
Location
Understand land-use compatibility, nearby habitation, environmentally sensitive areas, groundwater situation, drainage, waste-disposal infrastructure and state-specific siting requirements.
Depending on the project, applicability assessment may include:
One important conceptual distinction:
Industry pollution classification and Environmental Clearance applicability should not be treated as the same test.
An organisation should separately assess:
Do not assume that one automatically determines the other.
Suggested fields:
| Requirement | Legal/Regulatory Basis | Trigger | Authority | Applies? | Stage Required | Owner | Status |
|---|
The point is not to produce a perfect legal database on day one.
The point is that applicability becomes organisational knowledge rather than remaining only in one consultant's head.
Do not leave Stage 0 until the organisation can reasonably answer:
Move from knowing what applies to actively obtaining, maintaining and controlling environmental permissions.
The key shift is:
Approval as certificate → Approval as operational obligation
Depending on applicability, this may include:
The exact list varies by project, sector and state.
For every approval capture at least:
The most important operational information may be inside the approval rather than on the front page.
A consent condition such as:
Carry out stack monitoring quarterly.
should become:
Obligation: Stack monitoring
Frequency: Quarterly
Owner: EHS
Action: Arrange monitoring
Evidence: Laboratory report
Review: Check result against applicable requirement
Escalation: Investigate exceedance or missed monitoring
A consent should become a live compliance system.
Not a PDF archive.
Approval review should automatically occur when the company proposes changes such as:
Before approving the operational change, ask:
Does this change require amendment, fresh consent, new authorisation or another environmental review?
Environmental Approval & Authorization Register
plus:
Environmental Condition Register
Move forward only when:
Translate regulatory requirements and environmental risks into actual plant design and operating capability.
An environmental approval is permission.
It is not infrastructure.
Use a:
Condition-to-Commissioning Matrix
For each requirement:
Condition → Engineering Requirement → Design → Procurement → Installation → Commissioning → Performance Verification → Evidence
Wastewater
Air Pollution
Measurement
Waste
Chemical Management
Noise
A common mistake is to build pollution-control infrastructure but not measurement infrastructure.
Example:
A factory installs an ETP but only has one main water meter.
Later it knows:
Total water purchased = 100 KL/day
but cannot reliably separate:
This may become a major Stage 5 problem.
A better project asks two questions during design:
Commissioning should establish:
Environmental Infrastructure Commissioning File
containing appropriate:
Before normal operation, verify that:
Move from having approvals and equipment to maintaining environmental compliance continuously.
The core question is:
Can we remain compliant every day and prove it?
Five controls are fundamental:
A recurring requirement should have:
Owner + Frequency + Due Date + Evidence + Escalation
Example:
Requirement: Effluent monitoring
Frequency: Monthly
Owner: Environmental Officer
Due date: Defined monthly schedule
Evidence: Laboratory report
Review: Compare result against requirement and trend
Escalation: Investigation and CAPA for abnormality
Water
Wastewater
Air
Hazardous Waste
Other Waste
Regulatory
For every obligation:
Requirement → Activity → Record → Evidence
A single register entry is not the full evidence chain.
A strong Stage 3 organisation can quickly answer:
The information should not require a two-day internal search.
Environmental Compliance Operating System
The plant becomes:
regulator-ready, evidence-ready and inspection-ready.
Operational compliance should be reasonably stable:
Move from completing environmental tasks to systematically managing environmental risk and improvement.
Stage 3 asks:
Did we complete the required activity?
Stage 4 asks:
Is the system itself effective?
An environmental management system should normally address:
ISO 14001 can provide a recognised structure for this stage where appropriate.
Example:
The ETP stops performing.
Stage 3 response:
Restore the ETP.
Stage 4 response:
Why did performance deteriorate?
Was the cause:
Then ask:
What system change prevents recurrence?
That is the difference between compliance activity and environmental management.
Useful management review asks:
Functioning Environmental Management System
The organisation should have sufficiently stable operations and controls to begin trusting and structuring the data they generate.
This is where many companies discover that being compliant is not the same as being data-ready.
Produce complete, period-based, reconciled and traceable environmental information.
The core question is:
Can we reliably account for what physically happened?
For this framework:
An Environmental Accounting Ledger is a controlled, period-based record used to reconcile important environmental flows and link each material quantity to its source data, calculation and evidence.
It is an operational environmental-data concept.
It should not be confused with broader financial or academic uses of the term environmental accounting.
A simple way to understand it is:
Apply ledger discipline to physical environmental quantities.
Track water by source:
Then map water use:
Then map outputs:
A conceptual balance is:
Water In = Water Used / Consumed + Water Recycled + Water Discharged ± Measurement Difference
The goal is not artificial mathematical perfection.
The goal is to identify and explain material differences.
Water sources during a month:
Groundwater = 1,000 KL
Industrial supply = 500 KL
Tanker = 100 KL
Total water input:
1,600 KL
Known allocation:
Process = 800 KL
Domestic = 200 KL
Cooling = 300 KL
Other = 100 KL
Known use = 1,400 KL
Difference:
200 KL
A weak system simply adjusts one number.
A strong system investigates:
The difference itself becomes useful management information.
Track:
For each record retain:
Quantity → Unit → Period → Source → Evidence
Suppose diesel:
Opening stock = 5,000 L
Purchases = 25,000 L
Closing stock = 3,000 L
Consumption:
5,000 + 25,000 − 3,000 = 27,000 L
Simply using purchase quantity would report:
25,000 L
which is wrong for the period.
This distinction matters when fuel becomes greenhouse-gas activity data.
For each significant waste stream:
Opening Stock + Generation − Dispatch / Utilisation / Disposal = Closing Stock
Example:
Opening stock = 500 kg
Generated = 2,400 kg
Dispatched = 2,700 kg
Expected closing:
200 kg
Now test the number against:
If these sources disagree, investigate before reporting.
Greenhouse-gas inventories are calculations.
Underlying them are physical activities.
Depending on boundary, relevant activity data may include:
The key Stage 5 responsibility is not necessarily calculating every ESG indicator.
It is ensuring that the operational inputs are reliable.
Environmental intensity requires a denominator.
Maintain controlled production data:
Product → Quantity → Unit → Period → Source
Example:
Annual water = 12,000 KL
Production = 6,000 tonnes
Water intensity:
2.00 KL/tonne
Next year:
Water = 12,500 KL
Production = 7,500 tonnes
Water intensity:
1.67 KL/tonne
Absolute water increased.
Intensity improved.
Both facts matter.
Every important environmental number should answer eight questions:
At minimum, build controls for:
Environmental Accounting Ledger
covering as relevant:
Do not move to sophisticated dashboards until the underlying data is reasonably:
Turn reliable environmental data into management insight.
Stage 5 asks:
What happened?
Stage 6 asks:
Why did it happen, and what should we improve?
Possible environmental indicators include:
Water
Energy
Waste
Emissions
Compliance
Example:
Waste increased:
100 tonnes → 120 tonnes.
Production increased:
1,000 tonnes → 1,500 tonnes.
Waste intensity changed:
0.100 → 0.080 tonne waste per tonne production.
Efficiency improved, but absolute waste increased.
Management needs both views.
Every significant environmental change should have a reason.
For example, water intensity may increase because of:
Avoid generic explanations such as:
Increased due to operational reasons.
Possible targets:
A target needs:
Use:
Current Value → Previous Value → Change → Reason → Action → Owner → Deadline
Environmental Performance Dashboard
plus:
Environmental Improvement Programme
The organisation should be able to:
Translate environmental information into credible external reporting without recreating the data from scratch.
Possible reporting destinations include:
The practical lesson is:
Reporting requirements evolve.
Therefore the environmental data foundation should be built independently of one year's reporting template.
GRI operates through:
The important principle is:
Build durable source data, then map it to changing reporting frameworks.
Do not rebuild the operational system every time a reporting standard changes.
For each environmental disclosure:
Disclosure Requirement → Metric Definition → Environmental Ledger → Calculation → Source Records → Evidence → Reviewer → Final Disclosed Value
Reporting requirement asks:
Total water withdrawal by source.
Instead of emailing every department asking for water data:
Water disclosure
↓
Water-withdrawal metric
↓
Water ledger
↓
Groundwater meter + industrial-water invoice + tanker records
↓
Monthly reconciliation
↓
Annual number
↓
Review
↓
Disclosure
That is a controlled reporting process.
Every externally reported environmental KPI should document:
Ask:
Could another competent person reproduce this number from our documented source data and methodology?
If the answer is no, disclosure control remains weak.
Environmental topics may include:
Materiality determines where deeper measurement and disclosure are required.
Disclosure-Ready Environmental Dataset
capable of supporting relevant:
External environmental information should be:
Make environmental information part of business management.
The final destination is not:
Publish sustainability report.
It is:
Make better decisions because environmental information exists.
A machine is no longer evaluated only on:
It can also be evaluated on:
If water intensity or availability becomes a material risk, management may consider:
Reliable energy and emissions data can inform:
The question evolves from:
How do we dispose of this waste legally?
to:
Why are we generating it?
Then:
Supplier evaluation may progressively include:
Environmental Data → Insight → Risk/Opportunity → Decision → Investment → Action → Measured Outcome → New Data
Integrated Environmental Sustainability Strategy
The entire framework can be reduced to one chain:
Environmental Activity → Measurement → Operational Record → Evidence → Environmental Ledger → Performance Indicator → Sustainability Disclosure → Review / Assessment / Assurance → Management Decision → Operational Improvement
The next cycle begins with better operations.
A manufacturing process generates hazardous waste.
↓
Waste is identified and weighed.
↓
Generation is recorded.
↓
Storage balance is updated.
↓
Waste is dispatched through the applicable authorised route.
↓
Manifest and weighbridge evidence are retained.
↓
Recycler/TSDF acknowledgement confirms destination.
↓
Waste ledger reconciles:
Opening + Generation − Dispatch = Closing
↓
Annual waste metrics are produced.
↓
Waste-recovery or disposal indicators are calculated.
↓
BRSR/GRI/customer reporting uses the reconciled number.
↓
Management identifies prevention, recovery or circularity opportunities.
Water enters the factory.
↓
Meter records quantity.
↓
Water source is identified.
↓
Monthly record captures withdrawal.
↓
Water balance allocates major uses.
↓
Wastewater, reuse and discharge are measured or estimated.
↓
Annual water ledger is reconciled.
↓
Water intensity is calculated using production.
↓
Sustainability disclosure uses the controlled figure.
↓
Reviewer traces it back to source.
↓
Management identifies reduction or reuse opportunities.
Diesel is purchased.
↓
Stores records receipt.
↓
Opening and closing stock are measured.
↓
Actual consumption is reconciled.
↓
Consumption becomes GHG activity data.
↓
Approved emission factor and methodology are applied.
↓
Scope 1 emissions are calculated.
↓
Reported value is reviewed.
↓
Assessor or assurance provider can trace activity data back to evidence.
The sustainability number did not begin inside the ESG report.
It began with fuel movement.
Suppose effluent COD is regulated.
Compliance asks:
Is COD below the applicable limit?
Sustainability may ask:
Therefore:
Compliance establishes the legal baseline.
Environmental accounting establishes the data foundation.
Performance management creates insight.
Disclosure communicates the information.
Strategy uses it for decisions.
A company does not need to be directly required to file BRSR before sustainability data becomes commercially important.
An MSME may receive environmental-data requests from:
Typical questions may include:
For many companies, significant greenhouse-gas emissions occur outside their own direct operations.
Supplier activities can contribute to a customer's Scope 3 inventory.
This means the customer may eventually require better information about:
A supplier with controlled activity data is better placed to respond.
The nine stages are a logical progression.
But external pressure can force organisations to develop some later capabilities early.
For example:
An MSME may be:
Stage 3 in overall environmental systems
but need:
Stage 5 quality energy and emissions data
because a multinational customer requests it.
The framework is not a rigid staircase.
It is a capability map.
A mature industrial organisation should normally also build:
These systems may eventually form an integrated EHS management architecture.
But they are not inserted into the environmental spine simply to make the framework broader.
Social information may come from:
Examples:
Governance information may come from:
Environmental Data
Social Data
Governance Data
↓
Corporate Sustainability Reporting
This framework develops the environmental stream deeply because that is where physical operational events must be converted into reliable sustainability data.
Typical tools:
Main risk:
Organisational memory depends on individuals.
Typical controls:
Main improvement:
Data becomes consistent.
Typical capability:
Main improvement:
Information becomes organisational rather than personal.
Possible integrations:
Main improvement:
Duplicate manual entry falls.
Potential capabilities:
Main improvement:
Humans spend less time collecting data and more time reviewing exceptions and making decisions.
First define the process. Then structure the data. Then digitise. Then integrate. Then automate.
Automating a poorly defined process simply creates a faster poorly defined process.
Regulator / Customer / Investor / Reporting Standard
↓
Corporate Management
↓
Sustainability Team
↓
Plant EHS / Operations / Finance / Stores
↓
Measurement Requirement
↓
Physical Environmental Event
Meter / Invoice / Manifest / Monitoring Report / Record
↓
Environmental Ledger
↓
Plant Review
↓
Corporate Sustainability
↓
Disclosure
↓
Assessment / Assurance / Stakeholder
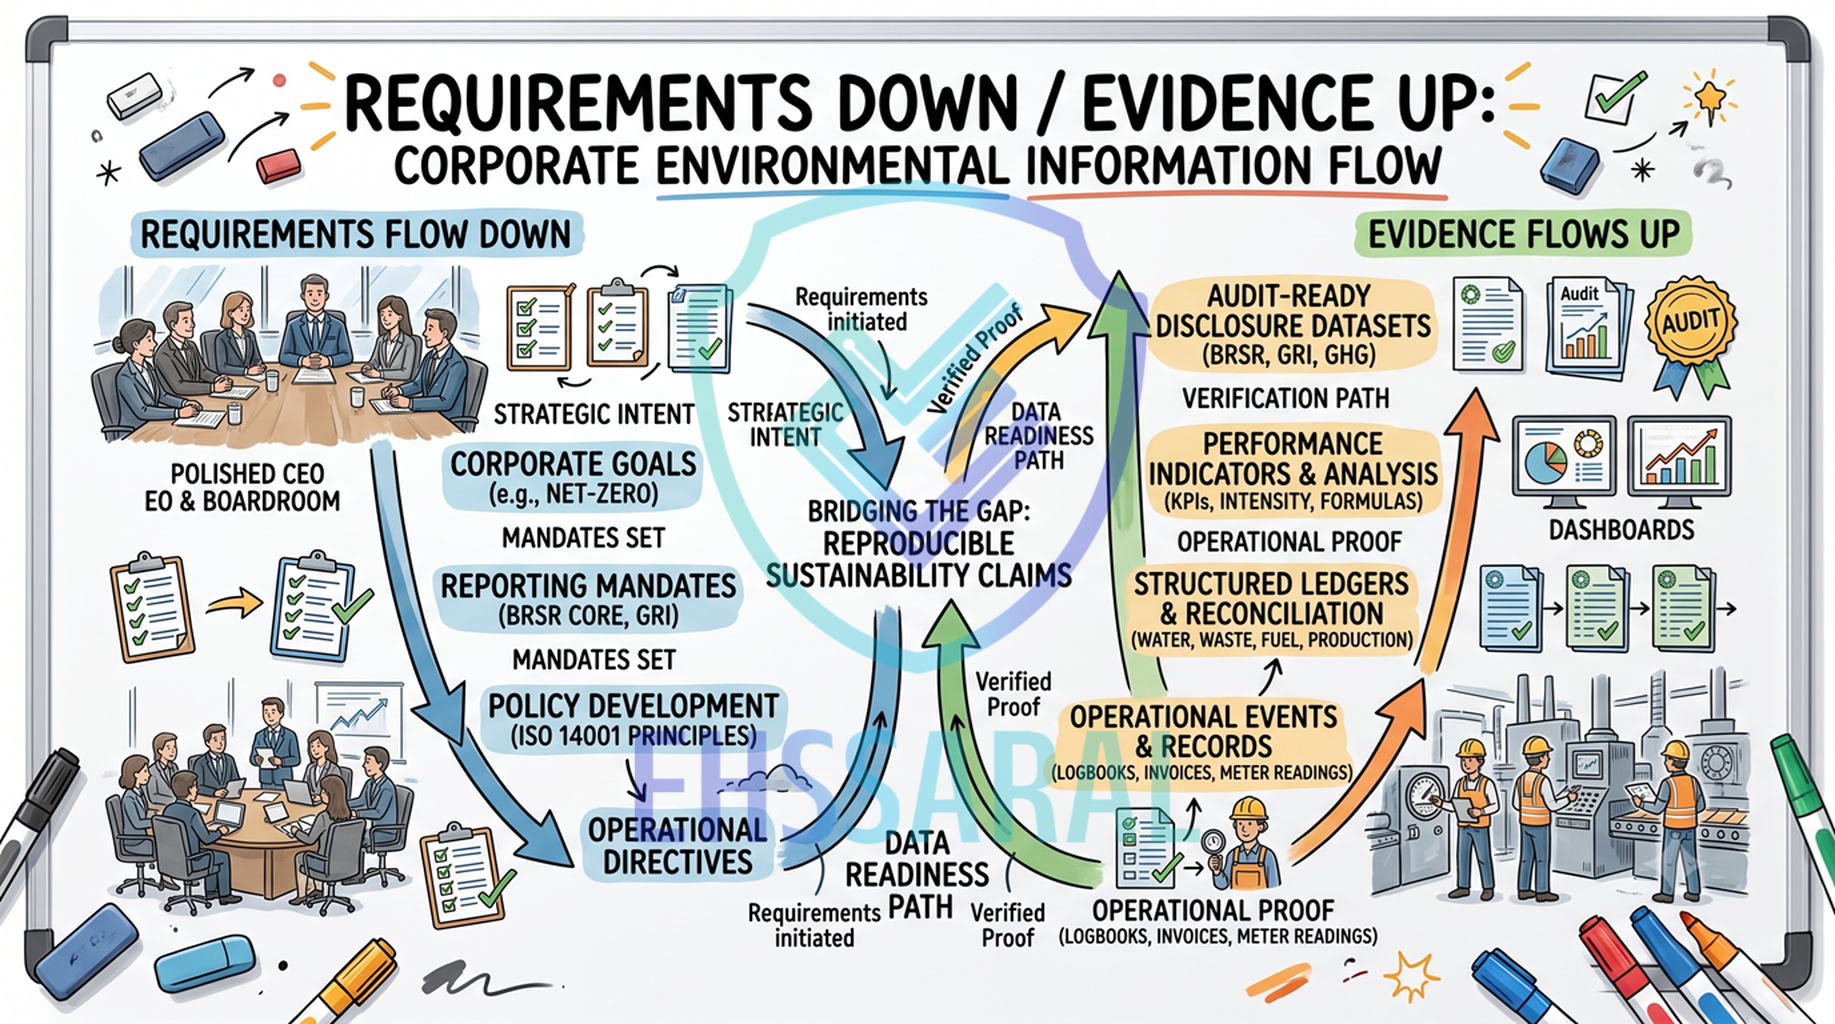
In weak systems:
requirements flow downward easily.
Evidence does not flow upward cleanly.
This creates:
In strong systems:
the reporting requirement can be traced down to its source,
and the evidence can be traced back up to the final disclosure.
A physical environmental event can support multiple legitimate outputs.
Example:
A hazardous-waste dispatch may support:
The organisation should not invent a separate version of the event for each report.
The design principle is:
Capture once → preserve evidence → reconcile → calculate → reuse appropriately
Not:
Collect again every time someone asks.
Build:
Identify:
Standardise monthly:
Define:
Start basic reconciliation.
Create:
Then ask:
Which environmental number would be most difficult for us to defend if an external reviewer challenged it tomorrow?
Start there.
Focus only on statutory limits.
Some annual totals and KPIs.
Monthly or quarterly trends, intensity metrics and variance explanation.
Targets, root-cause analysis, improvement programmes and management review.
Optimisation, predictive analytics and environmental performance tied to investment and operational planning.
Environmental matters are considered mainly after problems.
Environmental issues are considered during some projects.
Environmental information influences selected operational decisions.
Environmental performance influences capex, procurement and business planning.
Environmental risks and opportunities are embedded into long-term strategy, investment and business models.
Important requirements remain hidden inside PDFs.
The company may unknowingly operate outside the assumptions of the approval.
Annual reporting becomes difficult to defend.
Errors accumulate year after year.
GHG activity data may be wrong.
Water balance and intensity analysis remain weak.
Abnormal trends may go unnoticed even when a report exists.
There is no single source of environmental truth.
Assessment, assurance and credibility risk increase.
The organisation spends months reconstructing information instead of reporting controlled data.
This allows management to see both:
Are we compliant?
and:
Are we improving?
Use Stages 0–3 to build environmental compliance correctly from the beginning.
Then build Stages 4–8 progressively.
Score the organisation across:
Then identify the weakest material capability.
Start at Stage 7 and trace every proposed disclosure backward.
Ask:
Where does this number come from?
If the trail breaks at Stage 5, fix the data system before improving the report.
Do not begin with:
Which software should we buy?
Begin with:
Which capability is weak?
Then determine whether the problem requires:
What applies to us?
Output: Environmental Applicability Register
↓
What approvals do we require?
Output: Approval & Authorization Register
↓
What environmental systems and measurement infrastructure must exist?
Output: Commissioned Environmental Infrastructure
↓
Can we meet obligations every day and prove it?
Output: Environmental Compliance Operating System
↓
Are environmental risks systematically managed?
Output: Environmental Management System
↓
↓
Can environmental flows be reconciled and traced?
Output: Environmental Accounting Ledger
↓
Can we understand trends, causes and improvement opportunities?
Output: Environmental KPI & Improvement System
↓
Can our environmental information withstand scrutiny?
Output: Disclosure-Ready Dataset
↓
Does environmental information improve business decisions?
Output: Integrated Sustainability Strategy
The journey from environmental compliance to sustainability is not:
CTE → CTO → ISO 14001 → ESG Report.
That sequence is too simple.
The real journey is:
Understand what applies
↓
Obtain the right permissions
↓
Build the required environmental controls
↓
Operate compliantly
↓
Manage environmental risks systematically
↓
Build reliable environmental accounts
↓
Measure performance
↓
Produce traceable external disclosures
↓
Use environmental information in business decisions
A mature environmental organisation should be able to demonstrate that:
The ultimate test is simple:
If someone challenges an environmental number in your sustainability report, can you trace it all the way back to what actually happened inside the factory?
If the answer is yes, the organisation has built more than an environmental-compliance programme.
It has built an environmental information and management system capable of supporting credible sustainability.
And that is the real progression:
Permission → Compliance → Control → Accounting → Performance → Disclosure → Sustainability
An environmental compliance framework is a structured system for identifying applicable environmental requirements, obtaining approvals, managing conditions, maintaining records, monitoring performance and retaining evidence of compliance.
Requirements depend on the industry, process, capacity, location and environmental impacts. They may include Consent to Establish, Consent to Operate, Environmental Clearance, hazardous-waste authorisation, groundwater permissions, EPR registrations and other applicable approvals.
After obtaining Consent to Operate, the organisation must continuously manage consent conditions, environmental monitoring, statutory records, waste, returns, renewals, evidence and environmental performance.
No. ISO 14001 can provide a strong environmental-management system, but BRSR, GRI and other sustainability disclosures require reliable quantitative data such as water, energy, waste, emissions and production-linked indicators.
The Environmental Data Readiness Gap is the difference between being able to demonstrate environmental compliance and being able to produce complete, reconciled, traceable and reproducible environmental information for sustainability reporting.
Environmental disclosures may include energy, greenhouse-gas emissions, water withdrawal and consumption, waste generation and management, environmental compliance and other relevant environmental indicators. BRSR requirements sit within a broader corporate reporting framework.
In this framework, an Environmental Accounting Ledger is a structured record used to reconcile environmental quantities such as water, fuel, energy and waste and link those quantities to their source records, calculations and evidence.
Yes. MSMEs may receive sustainability-data requests from listed customers, multinational companies, investors, lenders or supply-chain programmes, particularly for energy, emissions, water, waste and environmental compliance.
Sources:

Founder, EHSSaral
Founder - EHSSaral | Partner - Perfect Pollucon | ISO 14001 Lead Auditor | GHG Protocol Scope 2 | Chemist | Data Scientist | Second-generation environmental professional simplifying EHS compliance for Indian industries through practical, automated, tech-enabled, data driven compliance workflows.
Hazardous Waste Rules & Management Explained | EHSShala
Rule 9 Hazardous Waste Utilization: Why Applications Fail (2023–2025) | EHSSaral Research
Water & Effluent Sampling Basics for Indian Factories | EHSSHala

New Labour Codes in India Effective Nov25: Mandatory Appointment Letters & Health Checks | EHSSaral

EHSShala Start – Begin Your EHS Learning Journey in India
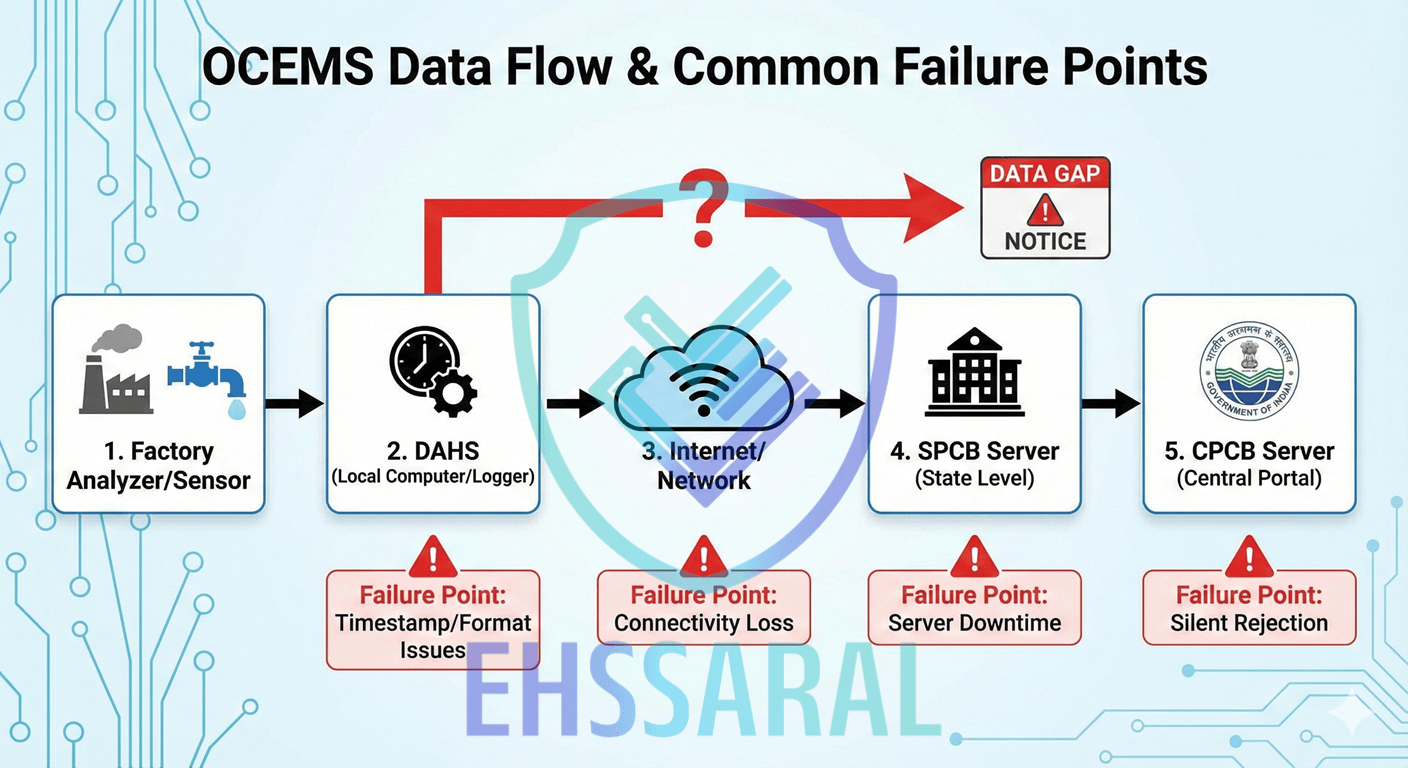
OCEMS Data Gaps Explained: Why CPCB Rejects Data & How to Fix | EHSSaral
MSME Supply Chains & BRSR 2026: Where Compliance Breaks | EHSSaral
SPCB Consent Conditions: Common Compliance Mistakes Explained | EHSSaral
Why Form IV Filing Becomes Difficult for Indian EHS Teams: A Field-Level Analysis
Construction & Demolition Waste Management in India Guide | EHSSaral