
Blog
Hazardous Waste Management Software India | EHSSaral
EHSSaral is an Environmental Compliance Intelligence Platform for Industries. Consent Intelligence • Alerts & Tasks • Incident Reporting • Form IV & V • Audit-Ready Records
See how EHSSaral works
18 Sep 2026
Author: Harshal T Gajare, Founder, EHSSaral
Credentials: ISO 14001 Lead Auditor | Partner, Perfect Pollucon LLP
Last updated: September 2026
Quick answer: An environmental compliance Key Performance Indicator (KPI) is a defined measure used to review a plant’s regulatory readiness, operational compliance or environmental performance over time. In an Indian manufacturing facility, useful KPIs may cover consent validity, monitoring completion, results against applicable limits, energy, greenhouse-gas emissions, water, effluent, waste and supporting evidence. The appropriate set depends on the plant’s permissions, processes, environmental aspects and reporting obligations.
Environmental performance in a factory cannot be understood from one number.
A plant may reduce its water consumption per tonne of production but miss a Consent to Operate renewal. Another plant may file every return on time while its energy intensity or hazardous-waste generation continues to increase.
Both situations require management attention, but for different reasons.
This is where confusion usually starts. Environmental compliance, pollution-control performance, resource efficiency and sustainability reporting are often placed on the same dashboard without explaining what each number represents.
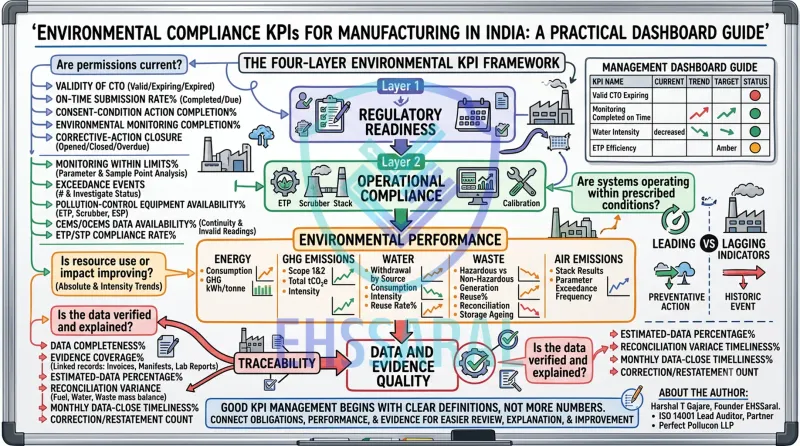
A practical environmental KPI system should therefore answer four different questions:
| KPI category | Question answered | Example |
|---|---|---|
| Regulatory readiness | Are our applicable permissions, submissions and scheduled obligations current? | Percentage of statutory submissions completed on time |
| Operational compliance | Are our operations and pollution-control systems meeting applicable conditions and limits? | Percentage of valid effluent results within applicable limits |
| Environmental performance | Is our resource use or environmental load improving? | Water consumed per tonne of production |
| Data and evidence quality | Can the reported information be verified and explained? | Percentage of reported KPI values linked with supporting evidence |
These four categories are connected, but they should not be treated as interchangeable.
An environmental KPI is a measurable indicator used to understand environmental status, performance or progress over a defined period.
A meter reading, laboratory result or waste quantity is not automatically a KPI. It becomes a useful KPI when the organisation defines:
For example, “water consumption was 8,500 KL” is a measurement.
“Water consumption per tonne of production increased by 12% compared with the approved baseline” is a KPI interpretation. It tells management that the change may require an operational explanation.
A measurement tells you what happened. A KPI helps you decide whether the result requires attention.
The terms are often used together, but they serve different purposes.
A compliance KPI evaluates whether an applicable permission, condition, limit, deadline or procedural obligation has been met.
Examples include:
Many compliance indicators are binary at the obligation level. A consent is either valid or not valid on a particular date. A return is either submitted by the applicable due date or it is not.
A percentage can summarise several obligations, but it should not hide an important individual failure.
A performance KPI measures the scale or efficiency of environmental impact.
Examples include:
Performance indicators normally show trends rather than a simple compliant or non-compliant result.
A data-quality KPI evaluates whether the information presented to management can be traced to its source.
Examples include:
This category becomes especially important when plant-level information is used for Form V, management reporting, customer questionnaires, carbon accounting or Business Responsibility and Sustainability Reporting.
A useful manufacturing dashboard should separate four layers of information.
Regulatory readiness KPIs provide forward visibility into permissions, submissions, monitoring schedules and pending compliance actions.
Purpose: To identify whether applicable environmental permissions are currently valid.
Formula:
Valid applicable permissions ÷ Total applicable permissions × 100
Applicable permissions may include, depending on the facility:
A 100% result does not mean there is no renewal risk. A permission may be valid today but expire shortly.
The dashboard should therefore show:
Purpose: To measure whether applicable returns, reports and submissions were completed by their due dates.
Formula:
Submissions completed on or before the due date ÷ Total submissions due × 100
Example:
A factory had 12 applicable submissions due during the quarter. Eleven were submitted by their respective due dates.
On-time submission rate = 11 ÷ 12 × 100 = 91.7%
The dashboard should also identify the missed submission. A high combined percentage should not make an important overdue return invisible.
Consent conditions include continuing requirements as well as one-time or periodic actions. It may therefore be misleading to mark every condition simply as “completed.”
A more useful KPI is:
Action-tracked consent conditions completed by due date ÷ Action-tracked conditions due × 100
Continuing conditions, such as operating pollution-control systems or maintaining records, should remain under ongoing review rather than being permanently marked as complete.
Factories that need help converting consent conditions into dated actions can refer to EHSSaral’s guide on creating an environmental calendar from consent conditions.
Purpose: To measure whether applicable monitoring was completed at the required frequency.
Formula:
Monitoring activities completed during the required period ÷ Monitoring activities due × 100
The monitoring schedule may cover:
Completion does not establish that the result was compliant. Monitoring completion and monitoring results should be displayed separately.
For monitoring scope and scheduling, see the environmental monitoring checklist for Indian factories.
Purpose: To understand whether environmental findings, incidents and deviations are being resolved on time.
Useful dashboard values include:
A closed action should have adequate closure evidence. Simply changing the status in a tracker does not demonstrate that the underlying issue has been resolved.
Operational compliance KPIs show whether processes and pollution-control systems are operating within applicable requirements.
Formula:
Valid parameter results within the applicable limit ÷ Total valid parameter results reviewed × 100
Results should be analysed at the parameter and sampling-point level.
For example, combining pH, Chemical Oxygen Demand, Biological Oxygen Demand and Total Suspended Solids into one percentage may conceal which parameter exceeded its applicable limit.
A useful dashboard should show:
“Percentage of applicable limit” may be calculated internally as:
Actual result ÷ Applicable limit × 100
This is an internal interpretation aid. It should not be presented as an official Central Pollution Control Board compliance index.
The correct limit should be established from the applicable standard, consent condition, authorisation, direction or other relevant requirement.
A simple compliance percentage may not show the severity or duration of an event.
The dashboard should separately capture:
One significant exceedance should not disappear inside a monthly average.
An exceedance may also trigger investigation, escalation, communication or reporting actions where these are required by the applicable consent, direction, procedure or regulatory condition. The dashboard should track the original event and any connected response obligations separately.
Formula:
Hours pollution-control equipment was available when required ÷ Total hours it was required × 100
Possible equipment includes:
Availability does not prove treatment effectiveness. Equipment can be available but poorly operated.
Availability should therefore be reviewed alongside:
This KPI should be used only where a Continuous Emission Monitoring System or Online Continuous Effluent Monitoring System has been prescribed.
Formula:
Valid monitoring-data hours ÷ Required monitoring hours × 100
The definition of valid data should address:
Data availability should not be treated as the same thing as compliance with emission or effluent limits.
A system may transmit data continuously while reporting questionable values. Conversely, a plant may have a genuine communication interruption even though the pollution-control process continues to operate normally.
Both situations require review, but they represent different problems.
Formula:
Instruments calibrated or verified by the applicable due date ÷ Instruments due for calibration or verification × 100
The instrument register should include:
If an instrument is found outside the acceptable calibration range, the plant may also need to review measurements recorded since the previous valid check.
A practical indicator is:
Valid outlet parameter results within applicable limits ÷ Total valid outlet parameter results reviewed × 100
Treatment efficiency can also be measured where useful:
(Inlet concentration − Outlet concentration) ÷ Inlet concentration × 100
However, treatment efficiency should not replace outlet compliance.
An ETP may show a large percentage reduction and still fail the applicable outlet limit. Conversely, a plant receiving low inlet concentrations may show a smaller percentage reduction while meeting the prescribed outlet condition.
Environmental performance KPIs help management understand resource use, pollution load and improvement trends.
They should normally include both absolute and intensity values.
Total energy consumption
Energy consumption should be reported by source before it is consolidated.
Possible sources include:
When sources are consolidated, they should be converted into a common energy unit using documented conversion factors.
Energy intensity
Formula:
Total energy consumed ÷ Defined production or business output
Possible units include:
The denominator should reflect the plant’s operations. Revenue-based intensity may be needed for a particular reporting framework, while physical production intensity is often more useful for plant management.
Renewable-energy share
Formula:
Eligible renewable energy consumed ÷ Total energy consumed on the same basis × 100
The numerator and denominator should use consistent units and boundaries.
The plant should also distinguish among:
No universal renewable-energy percentage applies to every Indian factory. The target should come from an applicable obligation, approved corporate commitment or internal improvement plan.
The internationally used greenhouse-gas accounting structure distinguishes:
Factories beginning carbon accounting commonly start with Scope 1 and Scope 2 because the required plant-level information is usually more accessible.
The GHG Protocol provides widely used standards and guidance for organisational greenhouse-gas inventories.
Total Scope 1 emissions
Possible sources include:
Total Scope 2 emissions
Scope 2 generally relates to purchased electricity, steam, heat or cooling.
Location-based and market-based Scope 2 results should not be mixed without explanation. Where both are reported, their calculation bases should be clearly identified.
GHG-emissions intensity
Formula:
Scope 1 and/or Scope 2 emissions ÷ Defined production or business output
The dashboard should identify:
Scope 3 should be included only when it is relevant to the reporting objective and can be calculated using a defined method.
Water withdrawal by source
Water withdrawal should be separated by source, such as:
This is more useful than reporting only one combined annual total.
Total water consumption
The organisation should define how water consumption is calculated and distinguish it from withdrawal.
Depending on the reporting framework and site water balance, consumption may consider:
The calculation method should remain consistent between periods.
Water-consumption intensity
Formula:
Total water consumed ÷ Defined production output
Possible units include:
Water-reuse rate
There are several legitimate ways to calculate water reuse. The selected denominator should therefore be stated.
One operational formula is:
Treated water reused ÷ Total treated water available for reuse × 100
Another management indicator may compare reused water with total water demand.
These two percentages answer different questions and should not be used interchangeably.
Effluent-generation intensity
Formula:
Total effluent generated ÷ Defined production output
This helps management determine whether increased effluent is explained by higher production or by changes in:
Zero Liquid Discharge indicators should be used only where ZLD is specifically applicable or adopted. A dashboard should not describe a facility as ZLD merely because some treated water is reused.
Waste data should be separated by category and management route.
Hazardous-waste generation
Report:
Hazardous-waste generation intensity
Formula:
Hazardous waste generated ÷ Defined production output
A higher result is not automatically evidence of poorer performance. It may arise from:
The trend should be investigated before it is interpreted.
Waste recovery or diversion rate
An internal formula may be:
Waste sent through defined reuse, recycling, recovery or co-processing routes ÷ Total waste generated × 100
The management route should be legally and technically appropriate for the particular waste.
“Diversion” is an internal performance term. It does not replace the classifications and quantities required in statutory records.
Hazardous-waste mass-balance variance
A basic mass balance is:
Opening stock + Waste generated − Waste dispatched − Closing stock = Expected variance
Ideally, the unexplained variance should be zero or within an approved and documented tolerance.
Differences may arise from:
A variance should trigger review. It should not automatically be labelled as non-compliance.
For a detailed method, see EHSSaral’s guide to hazardous-waste quantity reconciliation.
Hazardous-waste storage ageing
A useful dashboard can show:
The generally referenced 90-day storage provision must be interpreted with the applicable rules, permissions and permitted extensions.
EPR target achievement
This KPI is relevant only where the entity has an applicable Extended Producer Responsibility obligation for the particular waste stream.
Formula:
Eligible obligation fulfilled ÷ Applicable EPR obligation × 100
Plastic packaging, e-waste, battery waste and other EPR systems have different definitions, categories, portals and fulfilment mechanisms. They should not be combined into one generic EPR percentage.
Useful air-emission indicators may include:
Ambient air quality, workplace exposure and stack emissions should remain separately identified. They involve different monitoring locations, purposes and applicable criteria.
A dashboard may look complete while the records underneath it remain fragmented.
This layer evaluates whether management can trace a reported number back to its source.
Formula:
Expected records received and accepted ÷ Total expected records × 100
A record should be counted as complete only when it has been received, checked and accepted for the correct reporting period.
A bill, report or certificate received with an incorrect date range, missing page, incorrect site name or unresolved inconsistency remains incomplete until it is corrected or formally accepted through an approved exception process.
Examples of missing or incomplete information include:
Eleven months of data should not quietly become a twelve-month annual total.
Where useful, the plant can separately track:
Rejected or exception records ÷ Total records received × 100
This distinguishes whether information is unavailable or available but not yet usable.
Formula:
Approved KPI data points linked with adequate evidence ÷ Total approved KPI data points × 100
Possible evidence includes:
Formula:
Estimated data points ÷ Total reported data points × 100
Estimation is not automatically unacceptable. Meter breakdown, delayed bills or incomplete historical information may require an approved estimation method.
The dashboard should distinguish:
This gives reviewers a more honest understanding of data quality.
Connected environmental quantities should be compared.
Examples include:
A mismatch indicates that the records require review. It does not automatically prove that any individual record is wrong.
Formula:
Environmental datasets approved by the monthly closing date ÷ Total datasets due × 100
This KPI helps prevent year-end reconstruction.
EHSSaral’s monthly Form V data-collection guide explains how production, water, waste, monitoring and expenditure information can be closed progressively instead of being collected only before filing.
Track how many previously approved environmental values were later changed.
A correction may be valid, but repeated corrections can indicate:
Consider an effluent sample that exceeds an applicable outlet limit.
| Layer | What the dashboard should show |
|---|---|
| Regulatory readiness | Applicable consent condition, communication requirement and action due date |
| Operational compliance | Sampling point, parameter, result, applicable limit and investigation status |
| Environmental performance | Effluent volume, production, water use and recent parameter trend |
| Data and evidence quality | Laboratory report, sampling record, ETP log, instrument status and corrective-action evidence |
The same event appears across all four layers, but each layer answers a different question.
This is why the four layers should remain connected without being collapsed into one overall environmental score.
A practical management dashboard does not need every available environmental number. It needs a focused set that makes important conditions and trends visible.
| Dashboard area | Headline KPI | Review frequency | Typical owner | Supporting evidence |
|---|---|---|---|---|
| Permissions | Valid permissions and upcoming expiries | Monthly | EHS or compliance | Permissions, applications and acknowledgements |
| Statutory submissions | On-time submission rate | Monthly | EHS | Portal or submission acknowledgement |
| Consent conditions | Actions completed versus due | Monthly | EHS and action owners | Closure documents |
| Environmental monitoring | Monitoring completed versus due | Monthly | EHS | Laboratory reports |
| Effluent | Parameter results within applicable limits | Daily, weekly or monthly as relevant | ETP and EHS | Logs and laboratory reports |
| Air emissions | Parameter results within applicable limits | As prescribed | Utilities and EHS | Monitoring reports |
| Pollution-control systems | Required equipment availability | Daily or monthly | Utilities or maintenance | Operating and maintenance logs |
| CEMS or OCEMS | Valid data availability, where applicable | Daily | Instrumentation and EHS | System data and maintenance records |
| Energy | Total consumption and intensity | Monthly | Utilities and production | Bills, meters and production records |
| Greenhouse gases | Scope 1 and Scope 2 emissions | Monthly or quarterly | Sustainability, EHS and finance | Fuel and electricity records |
| Water | Withdrawal, consumption and intensity | Daily and monthly | Utilities | Meters, bills and production records |
| Water reuse | Treated water reused | Daily and monthly | ETP or utilities | Flow-meter and ETP records |
| Hazardous waste | Generated, dispatched and closing stock | Monthly | EHS and stores | Form 3, Form 10 and weighment records |
| Waste reconciliation | Mass-balance variance | Monthly | EHS and stores | Registers, manifests and acknowledgements |
| Storage ageing | Quantity approaching applicable storage limit | Weekly or monthly | EHS and stores | Storage and generation records |
| Environmental incidents | Events and overdue corrective actions | Weekly or monthly | EHS and operations | Incident records and closure evidence |
| Data quality | Completeness and evidence coverage | Monthly | EHS and data owners | Source records and review trail |
The dashboard should allow the user to move from the summary KPI to the underlying site, source, parameter, period and evidence.
Red-Amber-Green status can help management review a dashboard quickly, but the logic should be defined carefully.
Examples include:
A green status represents the current position, not necessarily the direction of travel.
A result may remain within the applicable limit while moving steadily towards an internal warning level. The dashboard should therefore show the current status together with the recent trend.
A green colour should not create complacency or replace technical review.
Amber should normally represent an internal warning or pending action, not a regulatory conclusion.
Examples include:
Examples include:
An internal amber threshold should not be presented as a statutory limit. Similarly, a green status should not be assigned only because a monthly average appears acceptable if a material individual exceedance remains unresolved.
Absolute and intensity values answer different questions.
An absolute KPI shows the total environmental quantity.
Example:
Total water consumed during the month: 8,500 KL
An intensity KPI relates the total to a production or business denominator.
Example:
Water intensity = 8,500 KL ÷ 4,000 tonnes = 2.125 KL per tonne
Intensity helps compare periods with different production volumes. However, it can also be misleading when reviewed alone.
A plant’s water intensity may improve while its total water consumption increases substantially because production increased.
Management should therefore review:
EHSSaral’s guide to explaining Form V data variation provides a detailed method for reviewing changes in water, waste, pollution and production data.
The denominator should represent the activity that causes the environmental load.
“Units produced” may work for a factory producing one relatively consistent product. It can become misleading when a facility manufactures products of very different size, mass or processing intensity.
Possible approaches include:
For example, one large fabricated assembly should not necessarily be treated as equivalent to one small component merely because both count as one unit.
The plant should document:
A change in denominator should be disclosed rather than silently applied.
A balanced dashboard needs both.
Leading indicators help management act before an obligation is missed or a failure occurs.
Examples include:
Lagging indicators show what has already happened.
Examples include:
Lagging indicators are necessary for accountability. Leading indicators make the dashboard useful for prevention.
Environmental information may use similar names in corporate reporting and plant compliance, but the purpose and boundary may differ.
| Area | BRSR or corporate reporting view | Plant compliance view |
|---|---|---|
| Energy | Enterprise energy footprint and intensity | Site energy use, equipment performance and applicable energy obligations |
| GHG emissions | Scope-based organisational inventory | Fuel, electricity, process and equipment-level source records |
| Water | Withdrawal, consumption and intensity across the reporting boundary | Source permissions, meter readings, water balance and consent conditions |
| Effluent | Consolidated discharge or water-management information | Outlet quality, quantity, operating logs and applicable discharge conditions |
| Waste | Waste generated and management routes across the reporting boundary | Category-wise generation, storage, manifests, dispatch and authorised destination |
| Air emissions | Selected corporate environmental disclosures | Source-specific monitoring against applicable limits |
| Evidence | Assessment or assurance support | Reports, registers, bills, manifests, certificates and inspection records |
The Securities and Exchange Board of India introduced BRSR Core as a defined subset of Business Responsibility and Sustainability Reporting. Its environmental attributes include energy, greenhouse-gas emissions, water and waste-related metrics.
SEBI subsequently issued the Industry Standards on Reporting of BRSR Core.
BRSR is mandatory for the top 1,000 listed entities by market capitalisation. BRSR Core assessment or assurance follows a phased applicability path, covering the top 500 listed entities for FY 2025–26 and the top 1,000 for FY 2026–27.
SEBI’s March 2025 circular introduced the current assessment-or-assurance framework.
This does not mean that every Indian factory is directly subject to BRSR Core.
However, factories may be asked to provide environmental information to a listed parent company, customer, lender or significant business partner.
Plant-level compliance records and corporate disclosures may depend on the same source data, but their boundaries, definitions and reporting periods can differ.
EHSSaral’s article on ESG data management for Indian factories explains how factory records can be structured, validated and connected with corporate reporting systems.
List:
Do not begin with a generic internet KPI list.
Consider:
For every KPI, identify the original source.
Examples include:
Every KPI should have:
A threshold may come from:
| Threshold type | Possible source |
|---|---|
| Regulatory limit | Applicable standard, consent or authorisation |
| Statutory deadline | Applicable rule or permission |
| Internal operating range | Approved operating procedure |
| Performance target | Management-approved improvement plan |
| Historical baseline | Defined base year or previous period |
| Technical range | Equipment design or manufacturer guidance |
Internal targets should not be presented as regulatory requirements.
Ask:
If the dashboard cannot answer these questions, it may be reporting data without supporting management action.
| Field | What to record |
|---|---|
| KPI name | Clear and specific name |
| Purpose | Decision or risk the KPI supports |
| Definition | Exact meaning of the indicator |
| Formula | Calculation or status logic |
| Unit | KL, MT, kWh, GJ, tCO₂e, percentage or count |
| Boundary | Site, process, equipment, entity or group |
| Frequency | Daily, weekly, monthly, quarterly or annual |
| Data owner | Department maintaining the source information |
| KPI owner | Person accountable for review and action |
| Reviewer | Person approving the final result |
| Target or limit | Applicable target, limit or trigger |
| Threshold source | Consent, rule, internal target or technical range |
| Source data | Bills, meters, reports, registers or calculations |
| Evidence | Documents supporting the final value |
| Estimation method | Approved method used when actual data is unavailable |
| Limitations | Known gaps or interpretation constraints |
| Escalation | Required action when a threshold is crossed |
An increase in consumption may be caused by increased production. Absolute values alone cannot show efficiency.
Intensity can improve while the organisation’s total environmental load increases.
Water, energy and waste may be driven by different processes. One generic production denominator may distort the picture.
Hazardous waste, non-hazardous process waste, municipal waste, e-waste and battery waste should not be combined without preserving their classifications.
Waste may be generated in one period, stored at the reporting cut-off and dispatched in another period.
Withdrawal, use, reuse, discharge and consumption describe different parts of the water balance.
A high environmental-performance score should not offset an expired permission or missed monitoring requirement.
A monthly average may appear acceptable while a significant individual result remains unexplained.
Estimated data should be identified along with the method, reason and approval.
A changed boundary, denominator, emission factor or calculation method can make trend comparison unreliable.
The applicable requirement should be established for the specific plant, source, process and permission.
A green dashboard status is weak if the supporting report, acknowledgement or record cannot be retrieved.
Before approving an environmental dashboard, check whether:
An environmental KPI is a defined measure used to review regulatory status, operational compliance or environmental performance over a specified period. Examples include monitoring completion, water intensity, waste generation and results within applicable limits.
Examples include valid permissions, on-time statutory submissions, consent-condition actions completed, monitoring completed, valid results within applicable limits, overdue corrective actions and waste movements supported by required records.
There is no universal list of five indicators for every organisation.
For manufacturing performance, a practical grouping is:
A compliance dashboard should additionally cover permissions, deadlines, operational controls and evidence quality.
An environmental KPI is any defined measure of environmental status or performance. A compliance KPI specifically evaluates an applicable permission, condition, limit, deadline or procedural obligation.
Useful manufacturing KPIs commonly cover permission validity, monitoring completion, effluent and emission results, energy intensity, water intensity, GHG emissions, waste generation, waste reconciliation, environmental incidents and evidence completeness.
Both should normally be reviewed.
Total consumption shows the plant’s absolute environmental load, while intensity shows consumption relative to production or another defined denominator.
No. BRSR directly applies to specified listed entities.
Other manufacturers may still receive environmental-data requests from parent companies, customers, lenders or listed value-chain partners.
Not necessarily.
Scope 3 depends on the reporting objective, organisational boundary and stakeholder requirements. Many factories begin by establishing dependable Scope 1 and Scope 2 information.
No.
ZLD indicators are relevant where Zero Liquid Discharge is specifically applicable, prescribed or adopted. Other plants may have permitted discharge, reuse or off-site management arrangements.
Only where continuous monitoring has been prescribed or installed.
Plants relying on periodic monitoring should track the applicable monitoring schedule and results instead.
The frequency depends on the indicator.
ETP operating parameters may require daily or shift-level review, while resource intensity may be reviewed monthly and corporate GHG information quarterly or annually.
It should show:
A summary score may be used internally, but it should not hide expired permissions, missed submissions, exceedances or unresolved incidents.
Material compliance exceptions should remain individually visible.
A reliable KPI has:
A useful environmental dashboard does more than display water, energy, emissions and waste totals.
It helps management understand:
Good environmental KPI management begins with clear definitions, not more numbers.
The most useful dashboard is not the one with the largest number of charts. It is the one that shows what requires attention, who owns the action and which records support the result.
When regulatory obligations, operational performance and evidence are connected, environmental information becomes easier to review, explain and improve.
Environmental KPIs become more useful when consent conditions, deadlines, operating records and supporting evidence remain connected. See how EHSSaral supports environmental compliance intelligence for Indian industries
Harshal T Gajare is the Founder of EHSSaral, an ISO 14001 Lead Auditor and a Partner at Perfect Pollucon LLP. His work focuses on connecting Indian environmental compliance requirements with practical plant-level records, environmental monitoring, hazardous-waste management and compliance data systems.

Founder, EHSSaral
Founder - EHSSaral | Partner - Perfect Pollucon | ISO 14001 Lead Auditor | GHG Protocol Scope 2 | Chemist | Data Scientist | Second-generation environmental professional simplifying EHS compliance for Indian industries through practical, automated, tech-enabled, data driven compliance workflows.
Hazardous Waste Management Software India | EHSSaral
MPCB Consent Explained - Lessons from 25 Years of Environmental Compliance | EHSSaral

Is There Truly Free Environmental Compliance Software in India? (An Honest Answer) | EHSSaral
Form IV Quantity Mismatch: Hazardous Waste Reconciliation | EHSSaral
 ehssaral.webp)
4-Stream Waste Segregation for Factories (SWM 2026) | EHSSaral

SPCB Consent Conditions: Common Compliance Mistakes Explained | EHSSaral
Water & Effluent Sampling Basics for Indian Factories | EHSSHala

EHS Officer Career Path in India (2025–2050 Guide) | EHSShala
 by EHSSaral v1.webp)
EADA Portal & Environment Audit Rules 2025: A Practical Guide for Indian Factories | EHSSaral
Plastic Waste Management Rules in India: A Practical Guide for Factories, Warehouses and Offices