

Why Form 4 & Form 5 Numbers Don’t Match - Real Industry Reasons
form 4 form 5 Hazardous Waste Environmental Compliance Hazardous Waste Management
Last updated:
|8 May 2026
Read time: 20 min read
Introduction
One of the most common questions industries face during environmental audits, inspections, or annual return preparation is this:
“Why are our Form 4 and Form 5 numbers different when both are based on the same plant operations?”
In many Indian industries, this confusion usually starts very late - often during:
- annual filing,
- consultant review,
- internal management verification,
- or SPCB inspection preparation.
At first glance, both forms appear connected to the same environmental activities:
- hazardous waste generation,
- treatment systems,
- disposal records,
- and operational data.
So naturally, management expects the numbers to match perfectly.
But from a practical standpoint, real industrial operations rarely behave in such a linear manner.
And this is where most confusion begins.
Quick Summary
Form 4 and Form 5 numbers may differ because both forms look at environmental data from different angles. Form 4 focuses mainly on hazardous waste movement, while Form 5 looks at overall environmental performance.
In real industries, mismatches usually happen because of timing gaps, moisture variation, vendor lifting delays, different units, closing stock confusion, and fragmented Excel-based records.
The real issue is not always non-compliance. In many cases, it is poor traceability and weak reconciliation.
The Reality Most Plants Experience
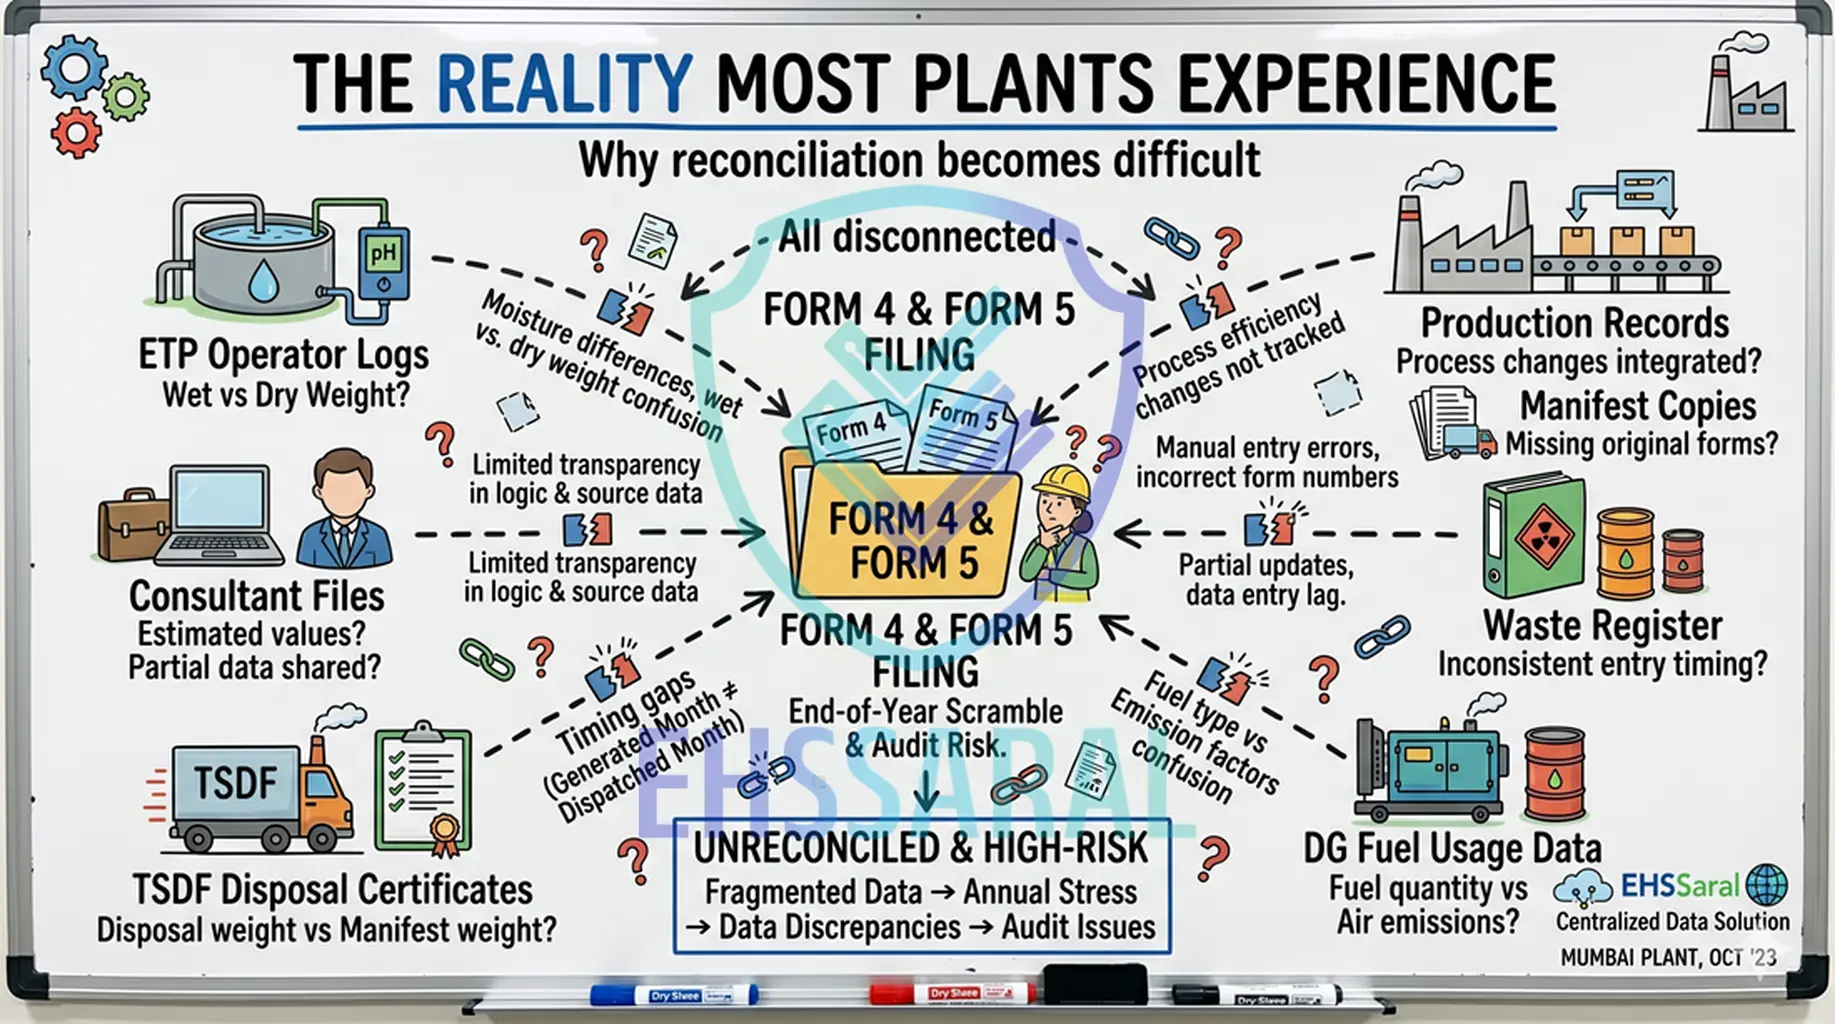
In day-to-day operations, environmental data is usually spread across multiple systems and departments.
For example:
| Data Source | Typically Maintained By |
|---|---|
| ETP logs | Utility / ETP operator |
| Hazardous waste register | EHS team |
| Manifests | Dispatch / EHS |
| Production data | Production department |
| DG fuel records | Utility team |
| Sludge disposal records | Vendor coordination team |
| Form 4 filing data | Consultant / EHS |
| Form 5 calculations | Consultant / Management |
Now imagine trying to reconcile all of this together at year-end.
This is where practical gaps start appearing:
- quantities differ,
- units differ,
- dates differ,
- assumptions differ,
- and sometimes even definitions differ.
Most mismatches are not intentional.
They are operational.
First Understand This Clearly: Form 4 and Form 5 Are Not Designed for the Same Purpose
This is probably the single biggest misunderstanding in Indian industries.
Many teams assume:
“Both forms deal with environmental compliance, so numbers should automatically match.”
But technically and operationally, both forms serve different objectives.
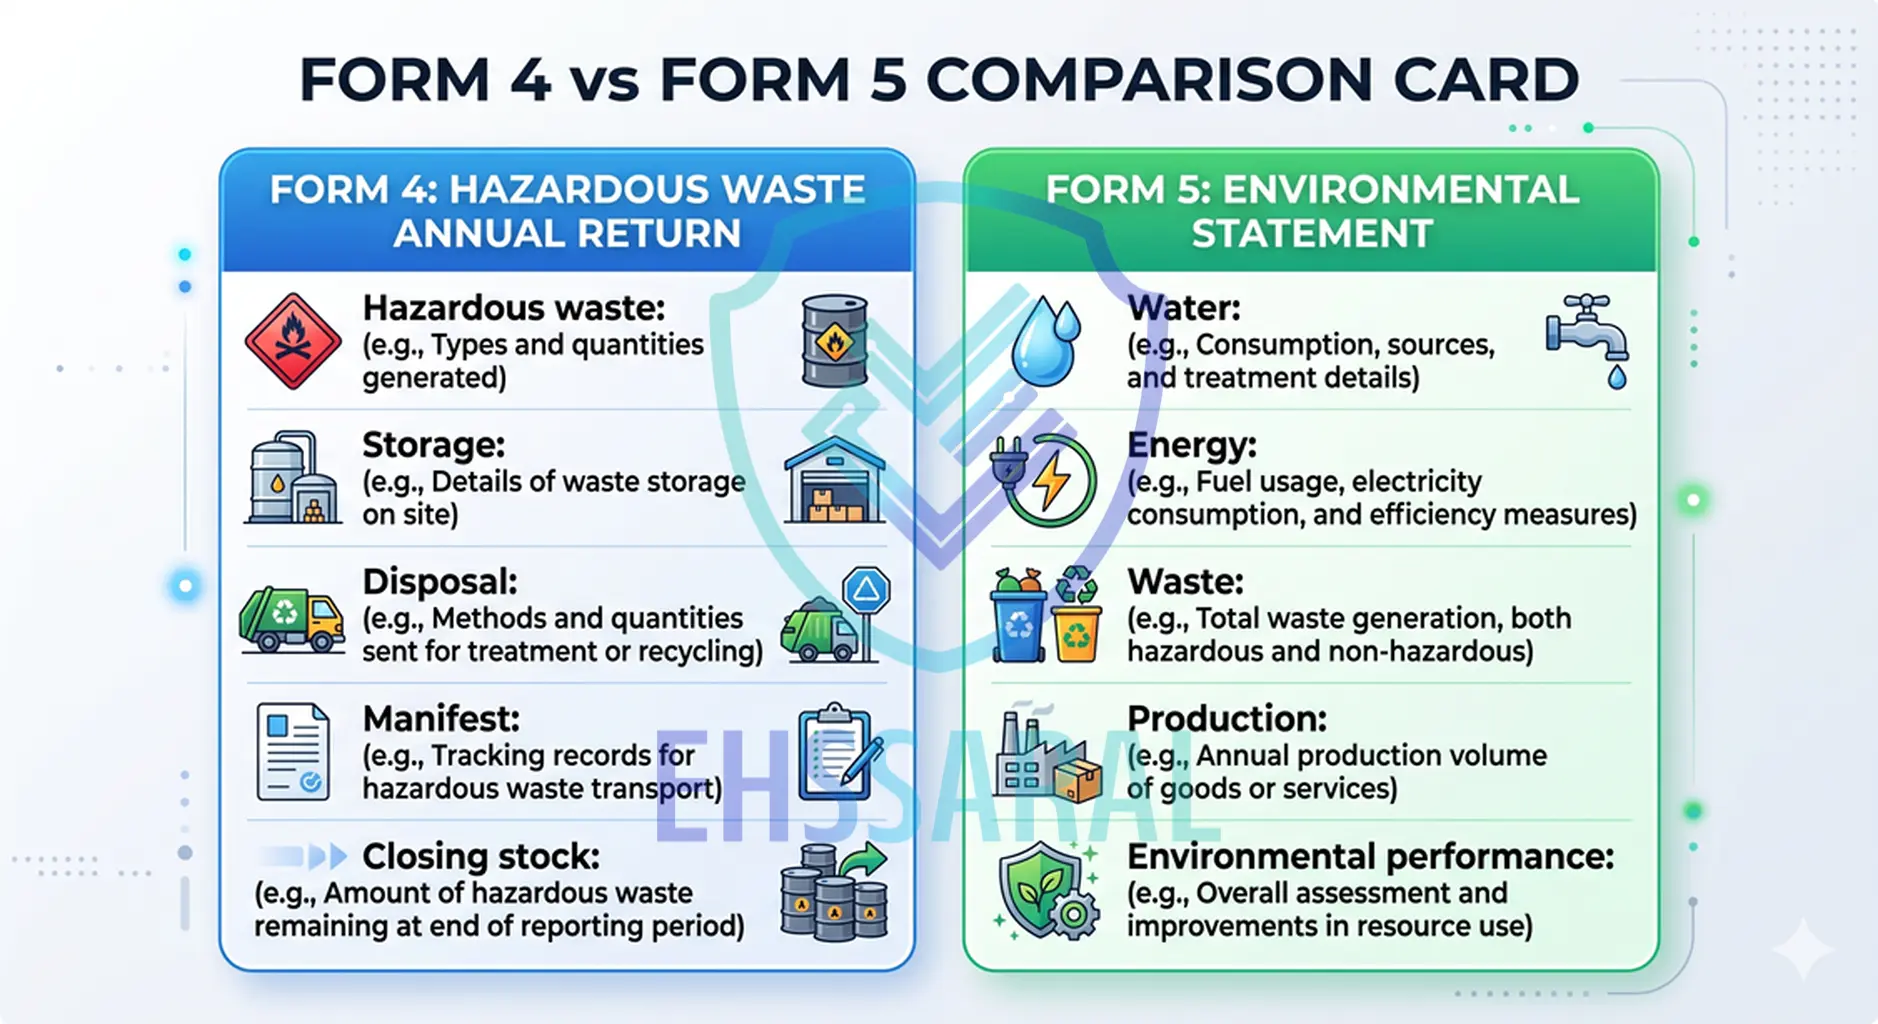
Form 4 – Hazardous Waste Annual Return
Form 4 is mainly focused on:
- hazardous waste generation,
- storage,
- transportation,
- disposal,
- recycling,
- co-processing,
- and closing stock.
It is essentially a hazardous waste movement and accountability document.
The regulator wants visibility into:
- how much hazardous waste was generated,
- where it went,
- who handled it,
- and whether it remained stored at site.
Form 5 – Environmental Statement
Form 5 is much broader.
It evaluates overall environmental performance of the industry, including:
- water consumption,
- energy usage,
- raw material consumption,
- pollution generation,
- treatment efficiency,
- hazardous waste,
- non-hazardous waste,
- and resource conservation efforts.
In simple words:
| Point | Form 4 | Form 5 |
|---|---|---|
| Main purpose | Hazardous waste tracking | Overall environmental performance |
| Main focus | Generation, storage, disposal, recycling, co-processing | Water, energy, raw material, pollution, waste, conservation |
| Data type | Waste movement data | Annual environmental summary |
| Common source | Hazardous waste register, manifests, stock records | Production, utility, ETP, waste and resource records |
| Main risk | Manifest and stock mismatch | Overall data inconsistency |
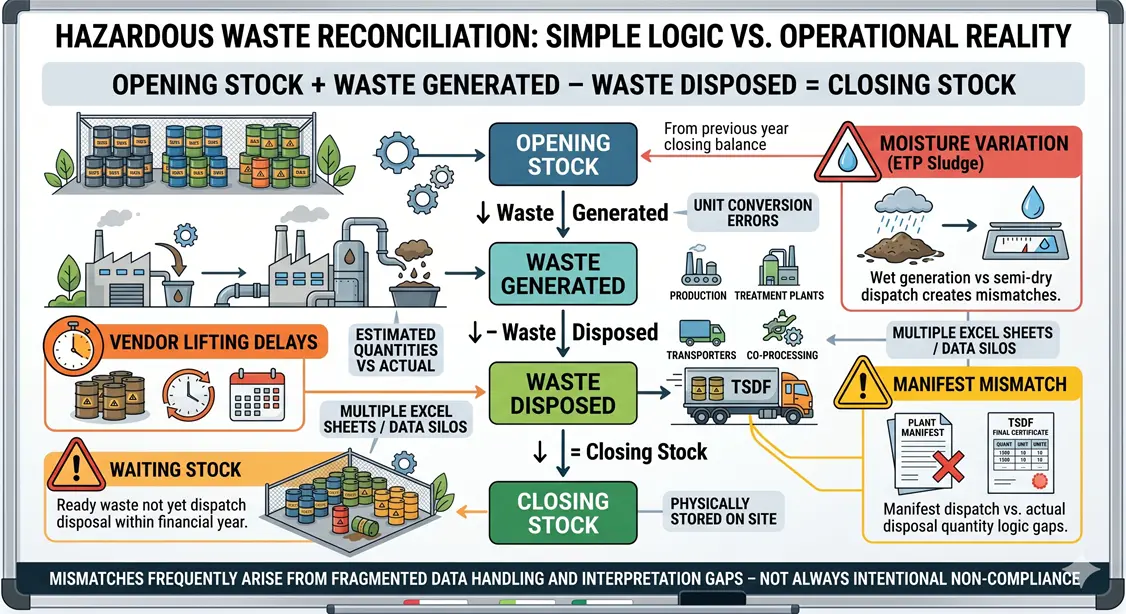
The Simple Reconciliation Logic Inspectors Often Use
During verification, regulators and auditors usually apply one basic logic:
Opening Stock + Waste Generated − Waste Disposed = Closing Stock
This formula looks simple on paper.
But in day-to-day operations, maintaining this balance across manifests, storage areas, sludge drying, delayed vendor lifting, and multiple reporting formats becomes difficult.
This is why even plants with genuine compliance efforts sometimes struggle to explain their numbers confidently.
The issue is not only the final number. The issue is whether the number can be traced back to actual plant records.
Why “Perfect Matching” Rarely Happens in Real Operations
Many industries unknowingly expect environmental records to behave like accounting ledgers.
But hazardous waste generation is influenced by multiple dynamic operational factors such as:
- moisture,
- process efficiency,
- production load,
- chemical dosing,
- machine shutdowns,
- cleaning cycles,
- fuel quality,
- and treatment plant performance.
For example:
- ETP sludge weight may increase during rainy season due to moisture.
- Production may increase but waste may temporarily reduce due to process optimization.
- Sludge stored for a few weeks may lose water weight before dispatch.
- One vendor may lift material immediately while another delays for days.
These are operational realities.
This is why experienced inspectors usually look less for “perfectly matching numbers” and more for:
- traceability,
- consistency,
- logic,
- and explainability.
In many cases, explainable variation is accepted more comfortably than artificially perfect records.
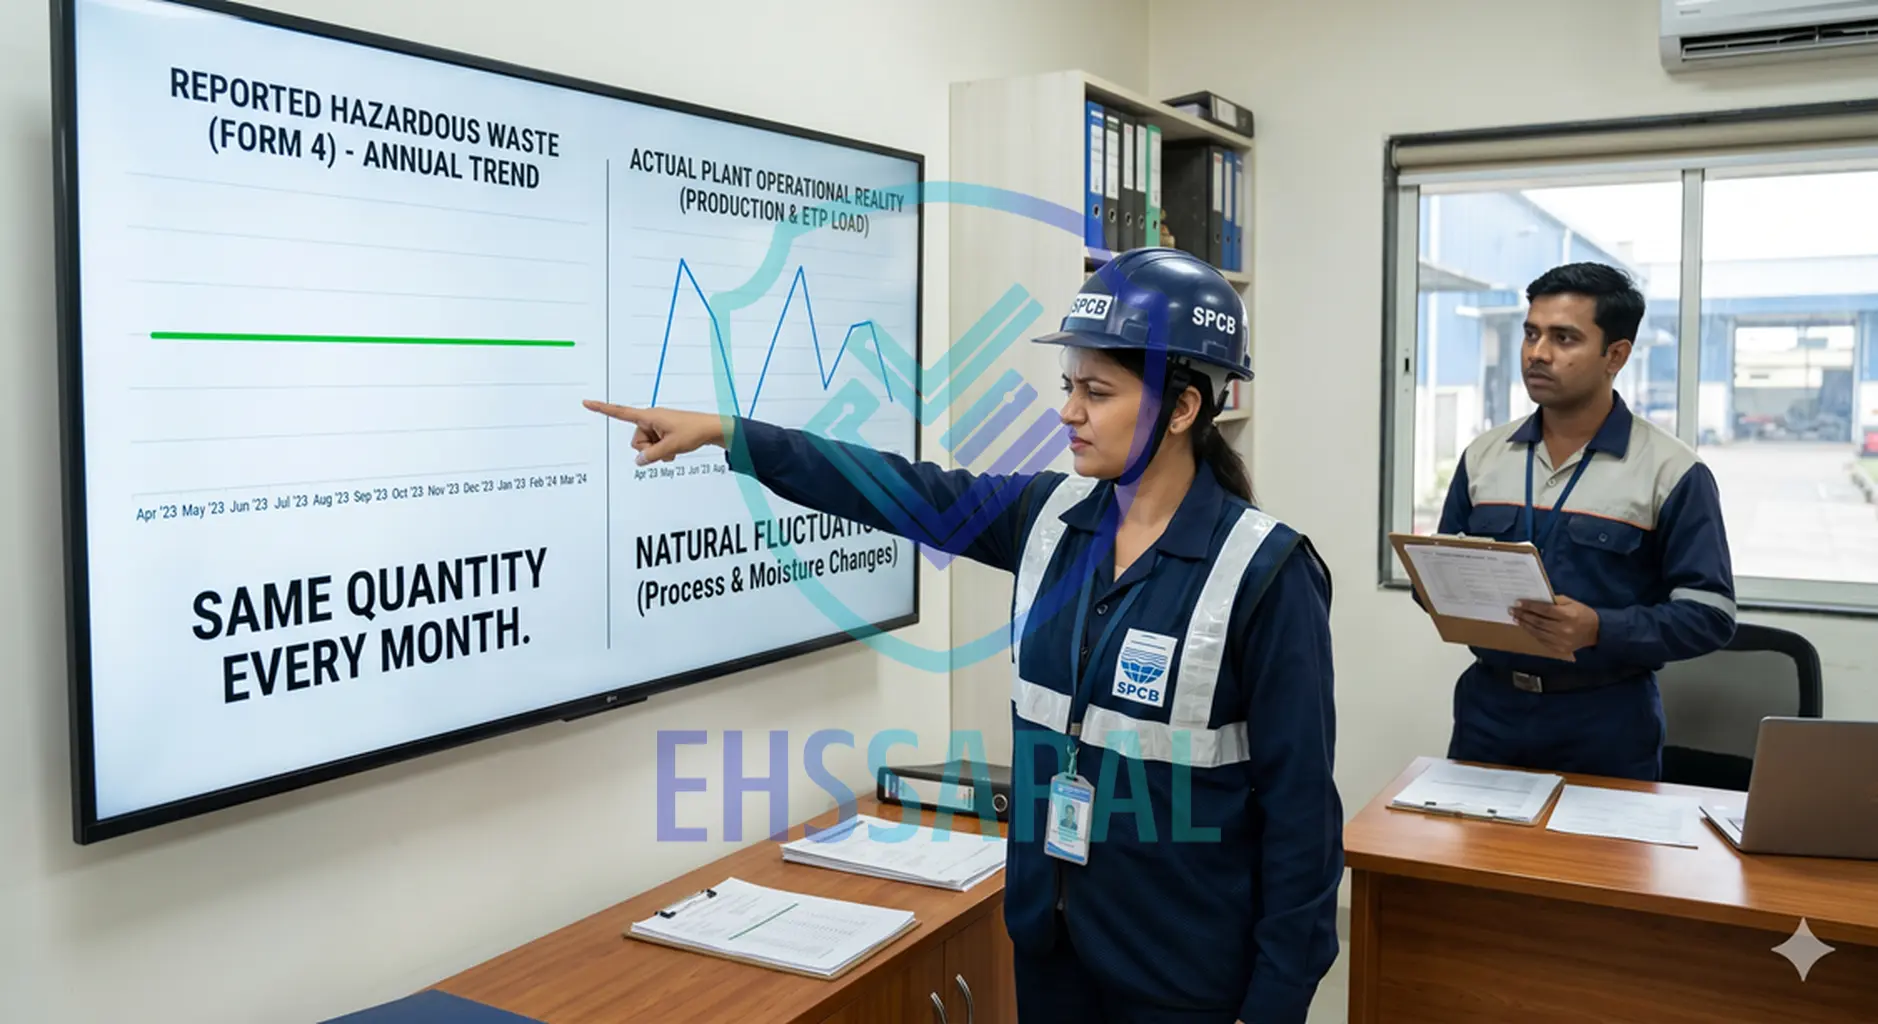
Why Perfect Numbers Sometimes Create More Suspicion
This may sound surprising to newer professionals.
But in practice, experienced auditors and inspectors often become cautious when they see:
- exactly identical waste quantities every month,
- zero closing stock every year,
- identical sludge generation despite production variation,
- perfectly linear environmental data,
- or copied historical trends without operational changes.
Industrial operations naturally fluctuate.
So when records appear too mathematically clean, it sometimes raises questions like:
- Was actual reconciliation done?
- Were estimates copied forward?
- Was data rounded excessively?
- Were storage variations ignored?
Over the years, many regulators have developed an operational sense of what “real plant variability” looks like.
This is why realistic, explainable records usually build more confidence than artificially perfect reporting.
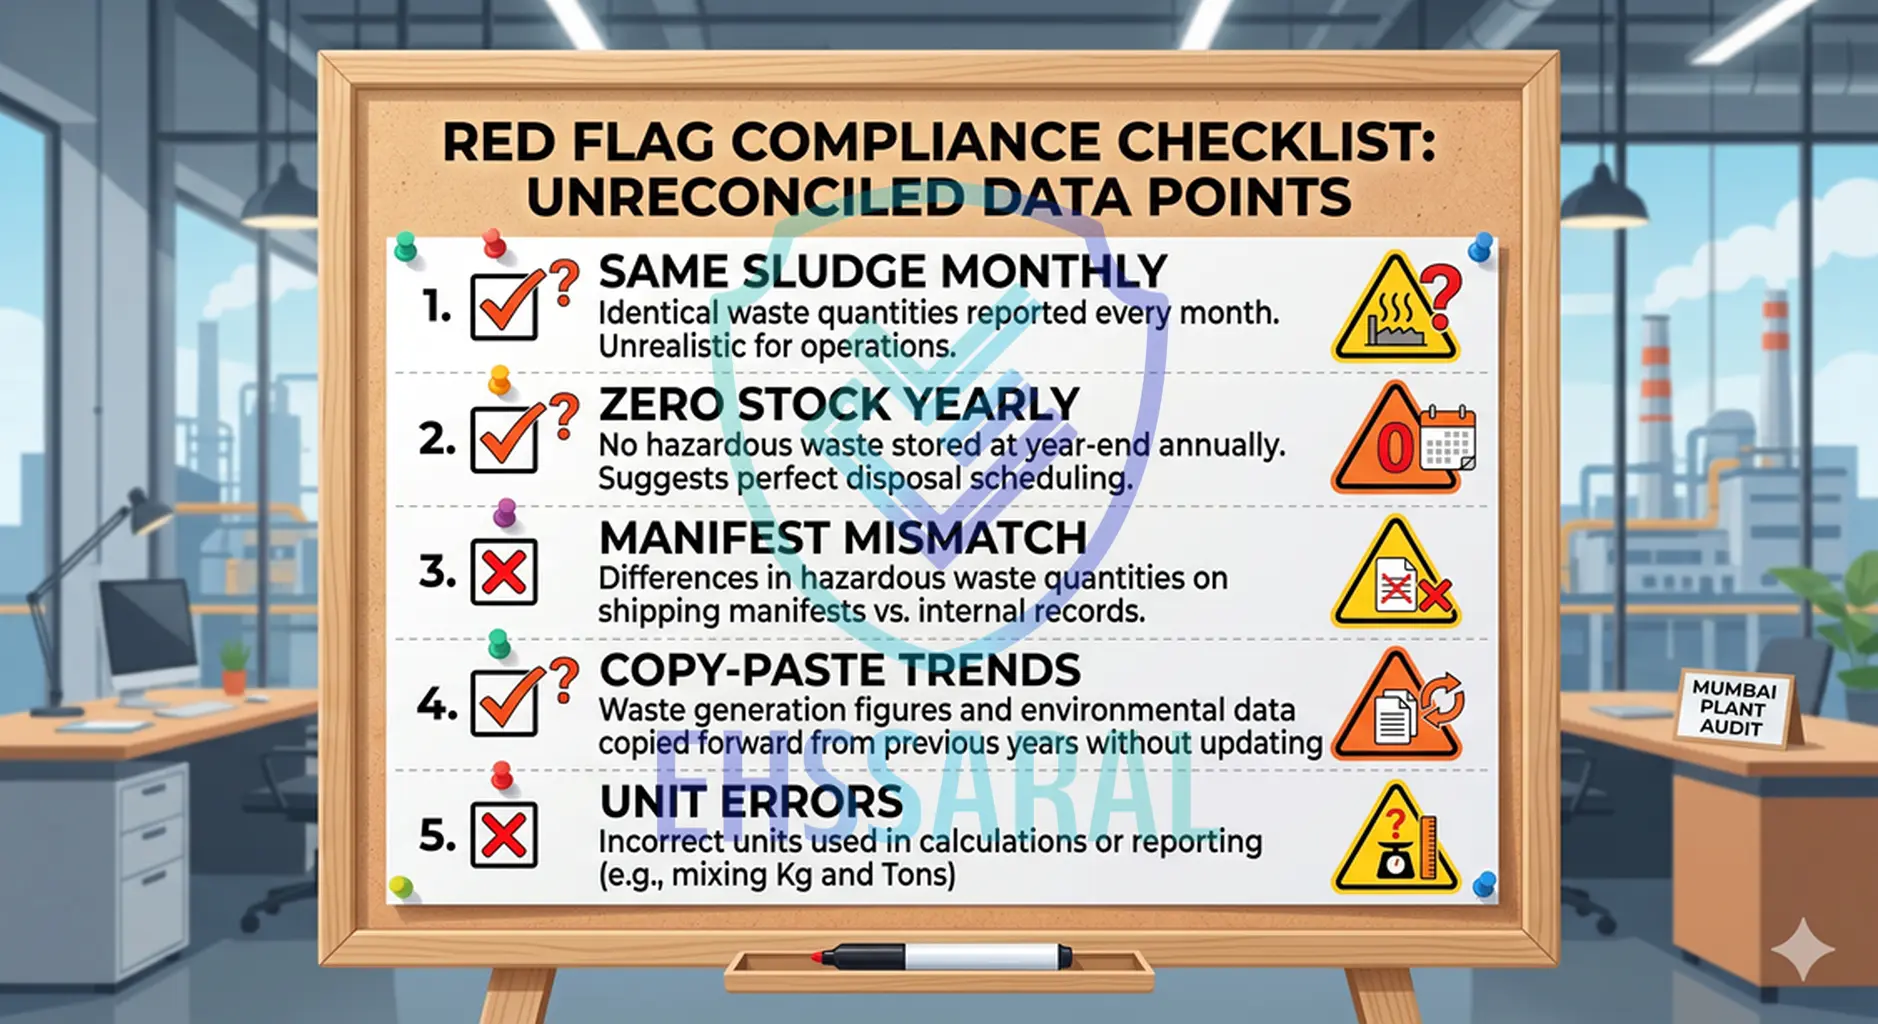
Common Red Flags Inspectors May Notice
During inspections or document reviews, certain patterns may attract more questions.
| Red Flag | Why It Raises Questions |
|---|---|
| Same sludge quantity every month | Real plant operations usually fluctuate |
| Zero closing stock every year | Continuous perfect disposal may look unrealistic |
| Production increased but waste stayed same | Needs operational explanation |
| Manifest quantity differs from Form 4 | Indicates traceability gap |
| Disposal shown without supporting manifest | Weak document linkage |
| Old values repeated from previous year | Suggests copy-paste reporting |
| Unit conversion errors | Creates major quantity mismatch |
These red flags do not automatically mean non-compliance. But they do increase the need for clear explanation and supporting records.
The Most Common Reason Form 4 & Form 5 Numbers Differ
The biggest practical reason is simple:
Different teams often prepare both forms using different source data.
For example:
- Form 4 may be prepared using manifest records and hazardous waste registers.
- Form 5 may be prepared using annual production summaries or ETP reports.
Now if:
- one dataset was updated,
- another was estimated,
- one included stored waste,
- and another included only disposed waste,
the final numbers naturally begin drifting apart.
And because these differences usually accumulate slowly across the year, they become visible only during final filing or inspection review.
This Is Where Confusion Usually Starts
In many Indian plants:
- hazardous waste tracking is monthly,
- production reporting is daily,
- manifests are event-based,
- and Form 5 preparation happens annually.
These timelines themselves are different.
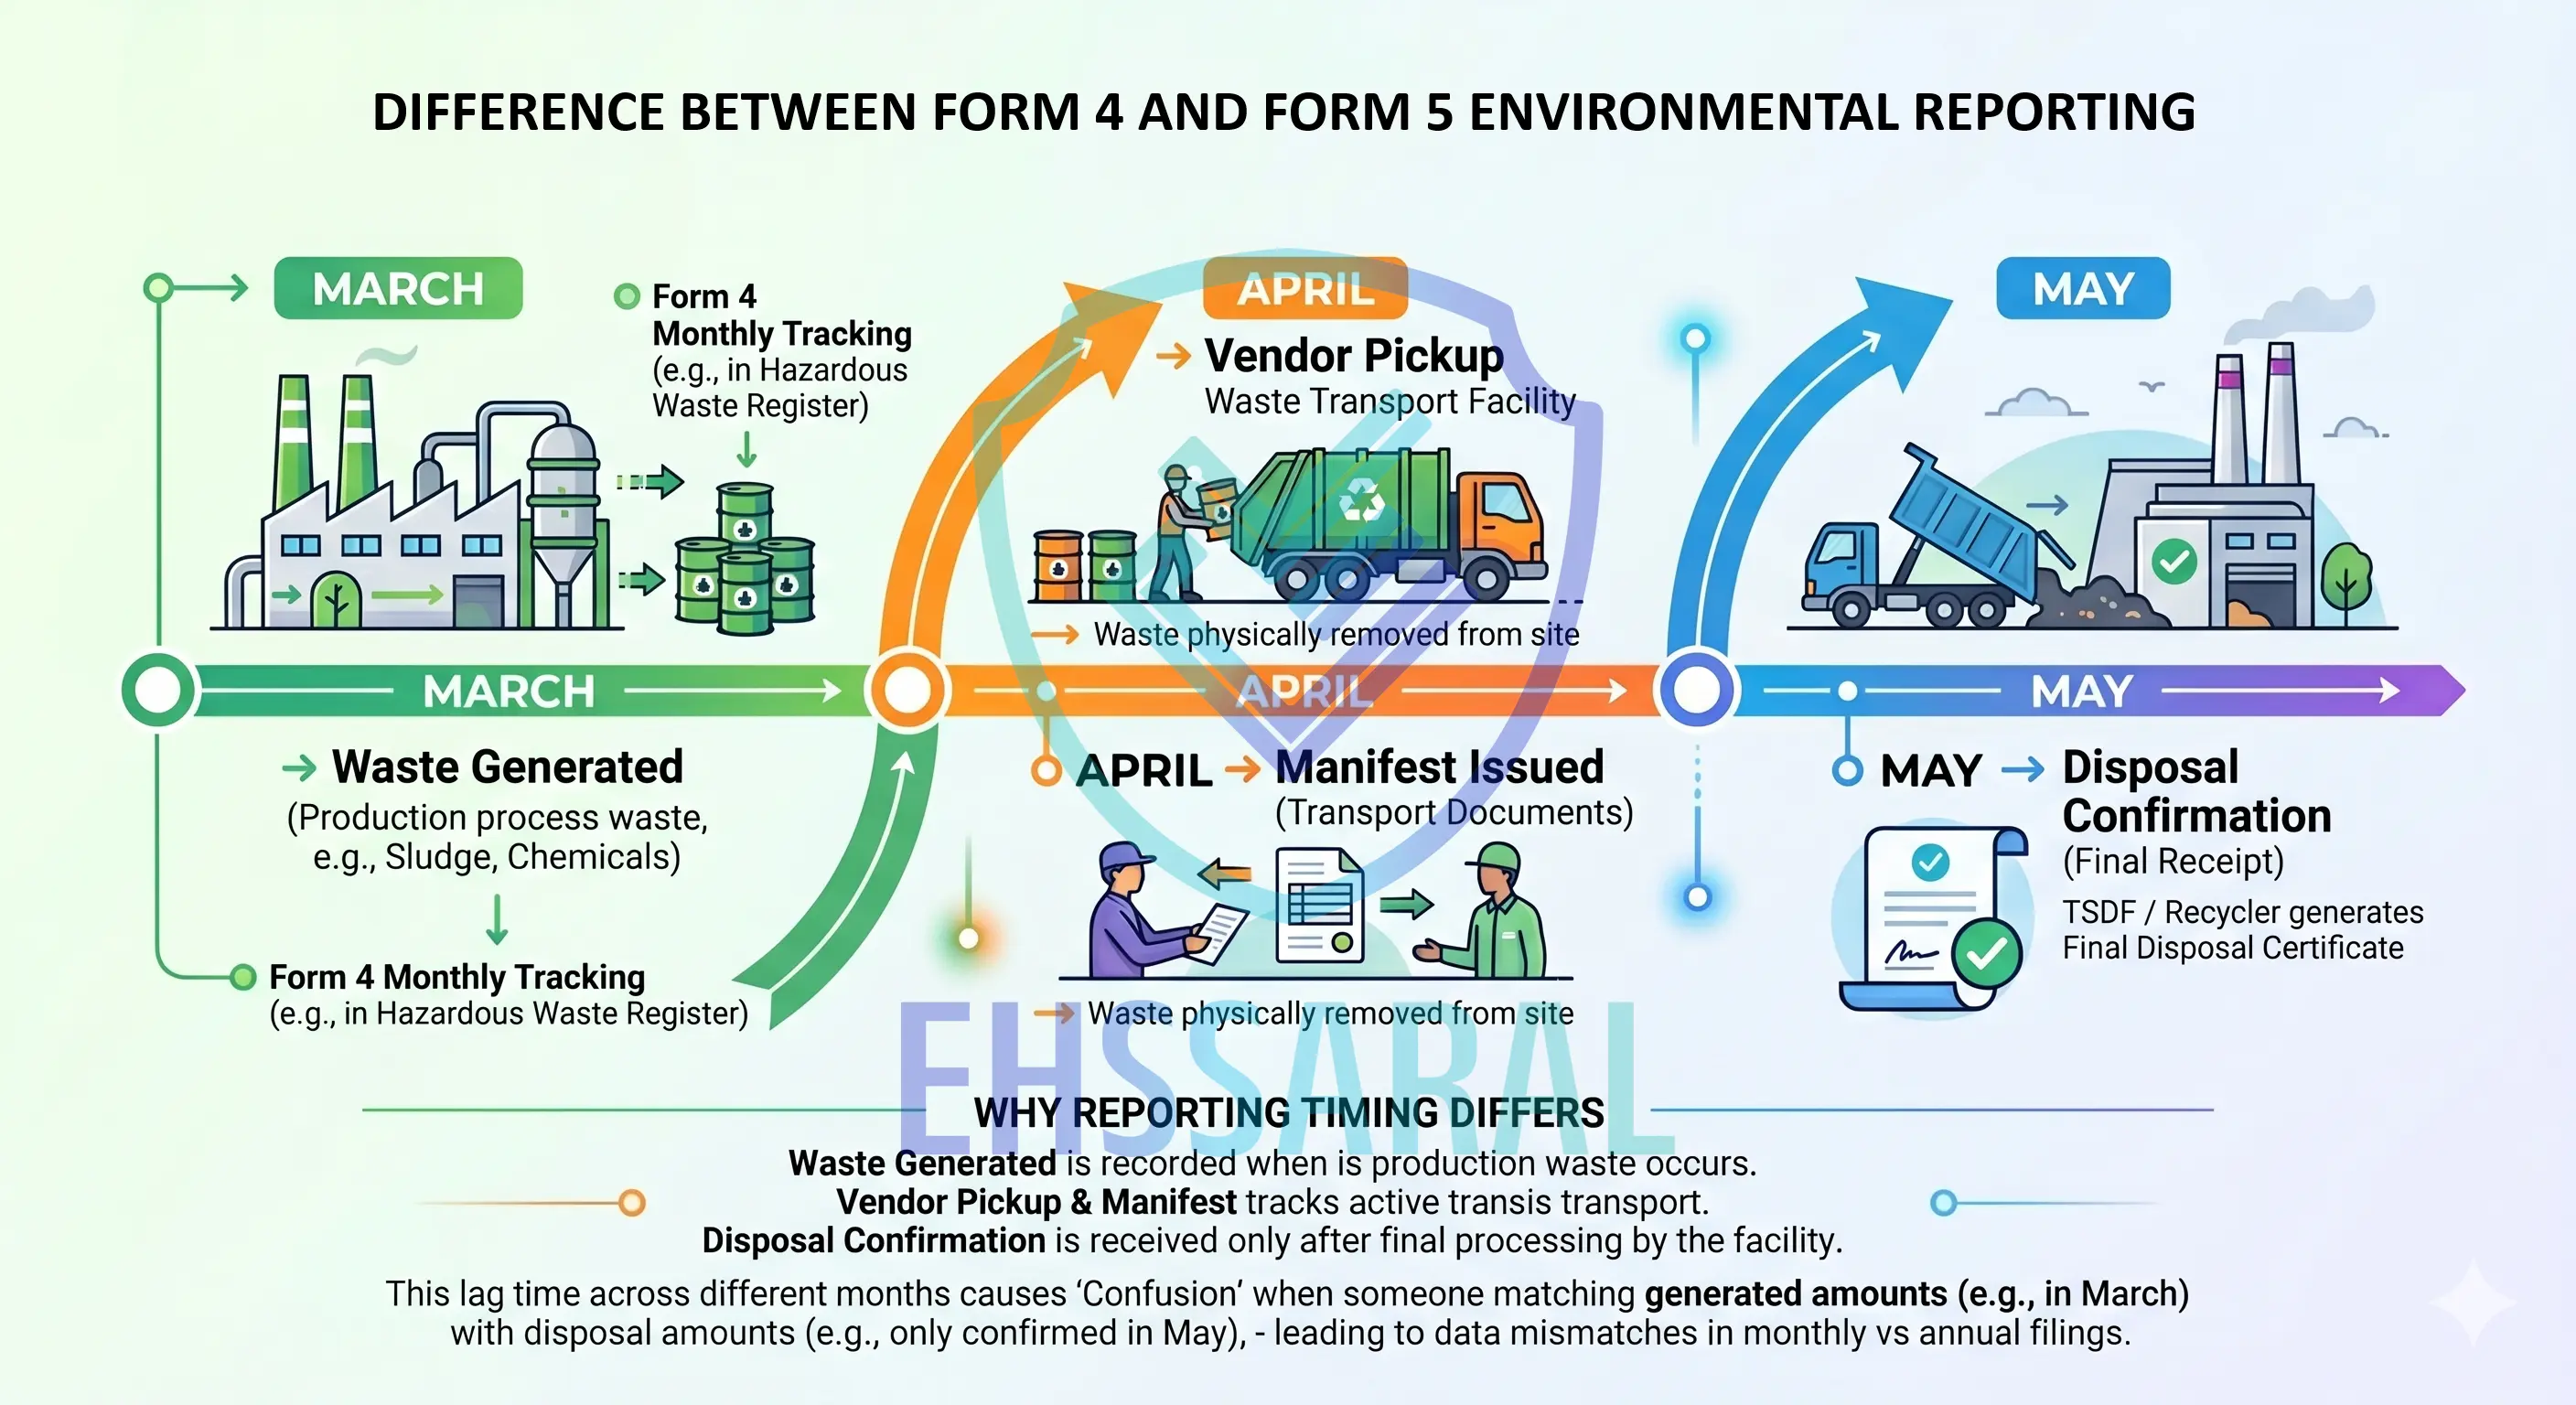
As a result:
- waste generated in March may be disposed in April,
- manifests may arrive later,
- revised quantities may be updated after dispatch,
- or consultant calculations may use a different cutoff date.
Eventually, everyone is working from “technically correct” data -
but from different operational moments.
And this is exactly why reconciliation becomes difficult without a structured tracking system.
Everyone is working from technically correct data - but from different operational moments.
Why Timing Differences Create Major Reconciliation Problems
One of the most overlooked reasons for mismatch is timing.
In environmental compliance, different activities happen on different dates:
- waste generation,
- storage,
- manifest preparation,
- transporter pickup,
- recycler acknowledgement,
- disposal confirmation,
- and annual filing.
But many industries unknowingly expect all records to align perfectly within the same reporting window.
Operationally, that rarely happens.
A Simple Example That Creates Confusion
Let us take a very common situation.
March Activity
A plant generates:
- 18 MT of hazardous sludge in March.
The sludge is:
- packed,
- labelled,
- and stored inside the hazardous waste area.
But:
- transporter arrives only in April,
- and final disposal certificate comes later.
Now different records may reflect different realities depending on timing.
| Record Type | What It Shows |
|---|---|
| March internal generation log | 18 MT generated |
| March closing stock | 18 MT stored |
| April manifest dispatch | 18 MT lifted |
| Recycler/TSDF acknowledgement | April disposal confirmation |
Now imagine:
- Form 4 prepared based on generation period,
- while Form 5 prepared later using disposal records.
The same waste quantity may appear in different operational stages.
This is one of the biggest reasons industries struggle during annual reconciliation.
Quarterly vs Annual Reporting Logic
Another practical challenge is reporting frequency.
Form 4
Hazardous waste reporting is usually tracked more frequently and operationally.
Industries maintain:
- manifests,
- stock registers,
- transporter records,
- and storage details continuously.
- Read more about Hazardous Waste Storage Rules in Indian Factories
Form 5
Form 5 is annual in nature.
It is usually prepared by combining:
- production data,
- water data,
- waste summaries,
- energy records,
- and treatment system performance.
Now naturally:
- annual summaries smooth out fluctuations,
- while operational waste records capture event-level activities.
This creates differences in:
- rounding,
- stock consideration,
- averaging,
- and timing assumptions.
Why ETP Sludge Creates the Maximum Confusion
Among all waste streams, ETP sludge is probably the biggest source of reconciliation difficulty.
Because sludge is influenced by:
- water content,
- treatment efficiency,
- production chemistry,
- and storage conditions.
And unlike packaged solid waste, sludge is operationally dynamic.
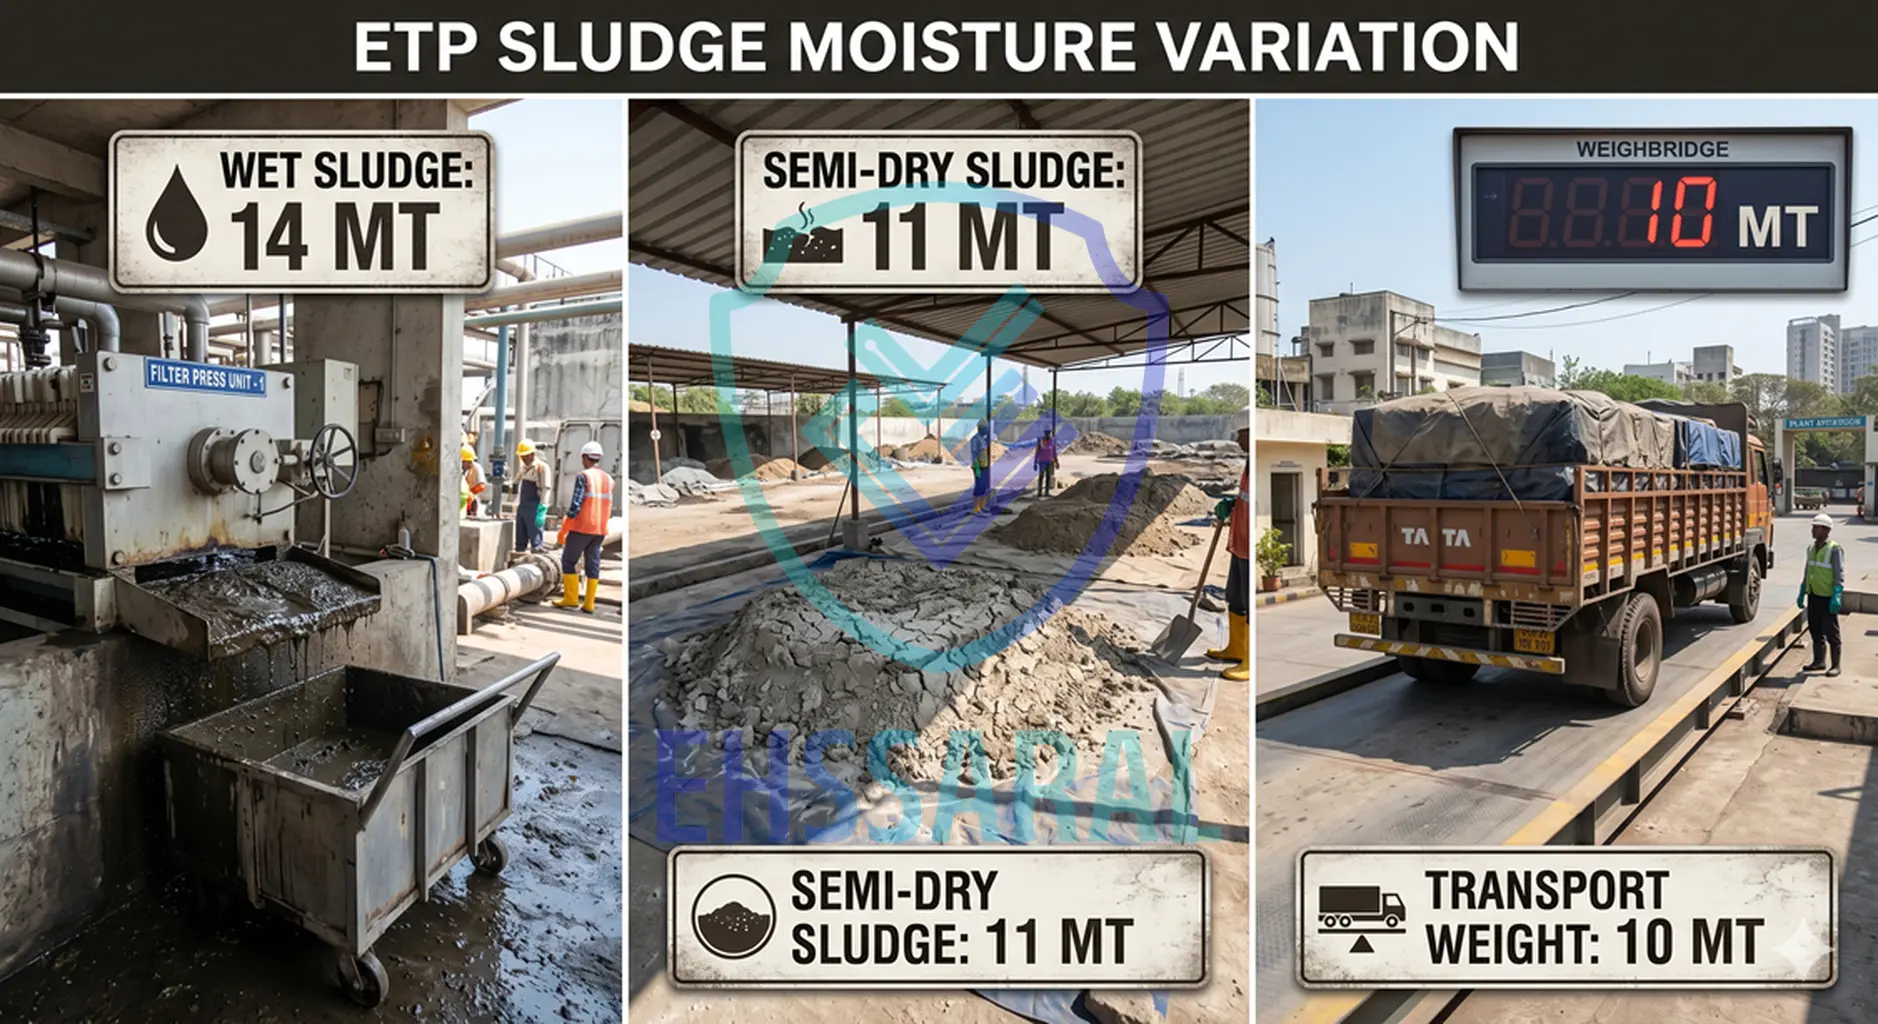
Example of Sludge Weight Variation
A plant may observe:
| Stage | Approximate Weight |
|---|---|
| Immediately after filter press | 14 MT |
| After partial drying | 11 MT |
| At transporter weighing bridge | 10 MT |
Now if:
- internal logs record wet sludge,
- transporter records semi-dry sludge,
- and Form 5 uses annual estimated sludge generation,
three different values begin circulating inside the same compliance system.
Without proper explanation, this appears inconsistent.
But operationally, it may be completely genuine.
Why Auditors Compare Production With Waste
Experienced environmental auditors rarely evaluate waste numbers in isolation.
They usually cross-check:
- production,
- raw material usage,
- water consumption,
- fuel usage,
- and pollution generation together.
Because environmental systems generally move in patterns.
For example:
- higher production often increases ETP load,
- higher fuel usage may increase ash generation,
- higher chemical usage may influence sludge quantity.
This does not mean:
“waste must increase proportionally every time.”
But if operational trends change significantly without explanation, it attracts scrutiny.
A Very Common Audit Observation
Consider this situation:
| Parameter | Previous Year | Current Year |
|---|---|---|
| Production | 1000 MT | 1700 MT |
| Water Consumption | Increased | |
| Fuel Consumption | Increased | |
| Hazardous Sludge | Exactly same quantity |
Immediately, auditors begin asking:
- Was sludge estimation reused?
- Was disposal fully recorded?
- Did treatment chemistry change?
- Was waste classification modified?
Again:
the issue is usually not the number itself.
The issue is:
lack of operational explainability.
Why “Zero Closing Stock” Often Looks Unrealistic
Many industries try to maintain “clean-looking” reports by showing:
- complete disposal,
- zero pending stock,
- and perfectly balanced numbers.
But in real operations:
- vehicles get delayed,
- waste accumulates,
- drums remain in storage,
- and dispatch schedules fluctuate.
So when every year shows:
Opening Stock = 0
Closing Stock = 0
it sometimes raises operational doubts.
Not because zero stock is impossible -
but because continuous perfect clearance is uncommon in many industries.
Inspectors usually understand that temporary storage is operationally normal.
What they expect is:
- proper storage,
- labelling,
- traceability,
- and disposal planning.
Why Different Departments Create Different “Truths”
One of the biggest operational realities in Indian industries is this:
Every department sees environmental data differently.
Production Team Thinks:
“How much process waste was generated?”
EHS Team Thinks:
“How much hazardous waste must be reported?”
Dispatch Team Thinks:
“How much material physically left the gate?”
Finance Team Thinks:
“How much disposal cost was paid?”
Consultant Thinks:
“What numbers are available before filing deadline?”
Now all of these perspectives may technically be correct.
But they are measuring different operational moments.
This is why reconciliation becomes difficult unless one unified system connects:
- generation,
- storage,
- dispatch,
- manifests,
- disposal,
- and reporting together.
The Real Risk Is Not Small Variation
From a practical standpoint, regulators usually understand:
- operational fluctuations,
- moisture differences,
- and dispatch timing delays.
What creates concern is:
- unexplained variation,
- inconsistent logic,
- missing supporting records,
- or inability to trace numbers back to source data.
For example:
- a 5–10% explainable variation may be acceptable,
- but completely unsupported numbers create compliance discomfort.
This is why documentation quality matters as much as final values.
This Is Where Most Plants Start Feeling Pressure
Everything appears manageable throughout the year.
Then suddenly:
- annual filing starts,
- consultant asks for reconciliation,
- management wants consistency,
- or inspection notice arrives.
Now teams begin manually searching through:
- old manifests,
- Excel sheets,
- weighbridge slips,
- vendor certificates,
- sludge records,
- and previous filings.
This is usually the moment industries realize:
environmental compliance is not just form submission.
It is actually a data management and traceability challenge.
Common Mistakes Industries Make During Reconciliation
In many industries, the actual mismatch does not happen because of one major error.
It usually happens because of:
- small assumptions,
- delayed updates,
- manual adjustments,
- and disconnected records
accumulating throughout the year.
By the time annual filing starts, the gap has already formed.
Let us look at some of the most common practical mistakes seen during reconciliation.
1. Treating Annual Filing as a “Last Week Activity”
This is probably the root cause behind many reconciliation problems.
In practice, some plants maintain:
- manifests,
- waste logs,
- and disposal records
throughout the year.
But actual reconciliation starts only near:
- filing deadlines,
- consultant follow-up,
- or inspection preparation.
At that stage:
- missing manifests appear,
- quantities remain unverified,
- stock calculations are incomplete,
- and different Excel sheets show different values.
Now teams start estimating instead of reconciling.
This creates stress very quickly.
2. Depending Entirely on Consultants Without Internal Validation
Consultants play an important role.
But operational data still belongs to the industry.
In many cases:
- consultants receive partial records,
- incomplete summaries,
- or manually prepared estimates.
Naturally, they prepare filings based on available inputs.
Later during inspection, management asks:
“Why are these numbers different?”
But the actual issue started much earlier during internal data collection.
Good compliance systems work best when:
- operations,
- EHS,
- utility,
- dispatch,
- and consultants
all work from synchronized records.
3. Ignoring Monthly Reconciliation
Many industries only review waste quantities annually.
But by then, tracing old operational differences becomes difficult.
For example:
- missing manifest from July,
- revised disposal quantity from October,
- stock correction in December
may all remain unnoticed until final filing.
This is why experienced plants usually maintain:
- monthly reconciliation,
- running stock balance,
- and periodic verification.
Small corrections monthly prevent major confusion later.
4. Not Maintaining One Master Waste Tracker
This is extremely common.
Different teams maintain:
- different Excel files,
- different units,
- different versions,
- and different assumptions.
Eventually:
- the manifest total differs from stock register,
- sludge quantity differs from ETP log,
- disposal quantity differs from invoice quantity.
Without one centralized tracker, reconciliation becomes dependent on memory and manual cross-checking.
And manual systems become fragile as plant complexity increases.
5. Confusing Estimated Quantities With Actual Quantities
In some operations, quantities are estimated operationally.
Examples include:
- tanker volume estimation,
- drum count conversion,
- sludge bag approximation,
- or average density assumptions.
Operationally, estimation is sometimes unavoidable.
But problems begin when:
- estimated values are later treated as exact values,
- or different teams use different assumptions.
Example
| Department | Assumption |
|---|---|
| EHS team | 1 drum = 50 Kg |
| Vendor invoice | 1 drum = 62 Kg |
| Manifest entry | Actual weighbridge value |
Now all records begin drifting slowly.
6. Forgetting Pending Storage Material
Sometimes waste is:
- generated,
- packed,
- and moved to storage area,
but not yet officially dispatched.
Operational teams may assume:
“It is ready, so consider it disposed.”
But regulators usually evaluate:
- actual storage,
- actual manifest movement,
- and actual disposal confirmation.
This creates a gap between:
- operational assumption,
and - compliance traceability.
7. Poor Manifest Traceability
Manifests are one of the most important reconciliation documents.
But in many industries:
- manifests remain scattered,
- scanned copies are missing,
- or acknowledgement copies arrive late.
Then during annual filing:
- teams estimate quantities from memory,
- vendor invoices,
- or partial records.
This becomes risky because inspectors often directly compare:
- Form 4,
- manifest totals,
- and disposal certificates together.
If one link breaks, confidence in the entire dataset reduces.
8. No Supporting Logic for Process Changes
Sometimes operational changes genuinely reduce waste generation.
For example:
- improved filter press efficiency,
- better chemical dosing,
- raw material quality improvement,
- process optimization,
- or partial recycling.
But if:
- waste suddenly reduces,
- and no operational explanation exists,
auditors may struggle to understand the change.
This is why maintaining simple operational notes becomes very valuable.
Even small documentation helps explain:
“Why this year was different.”
9. Mixing Hazardous and Non-Hazardous Waste Logic
This creates confusion in many plants.
Especially where:
- sludge classification changes,
- packaging waste exists,
- or multiple waste streams mix operationally.
Sometimes:
- one report includes mixed waste,
- another includes only hazardous fraction,
- and another uses disposal vendor category.
Eventually:
- all numbers appear different,
even though everyone believes they are reporting correctly.
This is why waste categorization consistency is extremely important.
10. No Clear Ownership of Environmental Data
One of the most overlooked problems is ownership.
In many plants:
- waste data belongs partially to EHS,
- partially to utility,
- partially to stores,
- partially to dispatch,
- and partially to consultants.
But nobody owns:
end-to-end reconciliation.
As a result:
- everyone manages their own part,
- but nobody validates the final connected picture.
This creates hidden gaps throughout the system.
What Experienced Inspectors Usually Check
In practical inspections, regulators often verify whether the environmental story makes operational sense.
They may compare:
- production vs sludge generation,
- water usage vs effluent generation,
- manifests vs disposal quantities,
- fuel consumption vs ash generation,
- storage area condition vs reported stock.
They also observe:
- whether records look operationally genuine,
- whether trends are explainable,
- and whether supporting documents exist.
In many cases, inspectors become more comfortable with:
- slightly variable but explainable data
than:
- perfectly clean but unsupported records.
Why Many Industries Feel Stressed During Inspection
Because environmental data is often maintained reactively.
Everything remains manageable until:
- inspection notice arrives,
- annual return deadline approaches,
- or management requests reconciliation.
Then suddenly teams begin:
- searching old emails,
- collecting manifests,
- checking weighbridge slips,
- correcting Excel formulas,
- and recalculating annual totals.
This creates unnecessary pressure.
Especially when multiple years of historical data must be verified quickly.
The Real Problem Is Usually Fragmentation
Most industries already have:
- data,
- manifests,
- records,
- invoices,
- and operational logs.
But the information exists in disconnected formats.
That fragmentation creates:
- duplication,
- missed updates,
- inconsistent assumptions,
- and reconciliation gaps.
Eventually, Form 4 and Form 5 simply expose those disconnected workflows.

Harshal T Gajare
Founder, EHSSaral
ISO 14001 Lead Auditor | Second-generation environmental professional simplifying EHS compliance for Indian manufacturers through practical, tech-enabled guidance.
Related Blogs
MPCB Consent Explained - Lessons from 25 Years of Environmental Compliance | EHSSaral
Hazardous Waste Storage Rules in Indian Factories | EHSShala
 ehssaral.webp)
Environmental Monitoring Checklist for Factories (India Guide) | EHSShala
Environmental Monitoring Guide for Indian Factories | EHSShala
BRSR Core 2026: Why Compliance Automation Is Now Mandatory | EHSSaral

Free Environmental Compliance Software in India: A Clear, Honest Answer | EHSSaral

What Is EHS & Why India Needs It | EHSShala

Can You Transfer Hazardous Waste Responsibility in India? (What the Law Says)